Informacje o artykule
DOI: https://www.doi.org/10.15219/em80.1420
W wersji drukowanej czasopisma artykuł znajduje się na s. 24-33.
 Pobierz artykuł w wersji PDF
 Abstract in English
Jak cytować
Egiebor, E., Adebowale, O., & Teng, T. (2019). Using Instructional Media to Improve Student Learning Outcomes in an Online Toxicology Course - a Case Study. e-mentor, 3(80), 24-33. DOI: 10.15219/em80.1420
E-mentor nr 3 (80) / 2019
Spis treści artykułu
- Abstract
- Introduction
- The PATHs Framework Approach to measuring engagements with instructional media
- Research questions
- Hypothesis
- Study context
- Results and discussion
- References
Informacje o autorach
Using Instructional Media to Improve Student Learning Outcomes in an Online Toxicology Course - a Case Study
Egbe Egiebor, Oluwakayode Adebowale, Tian-Lih Teng
Abstract
This case study investigated how student interaction patterns (Moore, 1993) with different instructional media in a graduate level online environmental toxicology course impacted student outcomes, as measured by grades and student engagement levels. Student engagement levels were measured as Posts, Access, Time, and Hits (PATHs) by using the PATHs Framework (Adebowale, 2017) approach to quantify learning analytics obtained from a Learning Management System. Data was obtained from 13 online students during the fall 2018 semester. Findings indicate that Narrated PowerPoint and Shaky Hand video led to higher student outcomes compared to the other forms of instructional media. Implications for course design, quality assurance mechanisms, assessments, improvement of student outcomes, and criteria for selecting the type of instructional media to use in online courses are also discussed.
Keywords: Instructional Media, PATHs analytics framework, transactional distance, narrated PowerPoint, shaky hand video, YouTube video, student outcomes, assessments, media richness, course design, learning management system, and course reports
Introduction
Over three million students are currently enrolled in fully online programs, and over six million are taking at least one course online as part of their online degree (Allen & Seaman, 2017). This proliferation of online education as an alternative to traditional classroom education makes salient the need for online instructors to continually improve student learning outcomes in online courses. For example, Weiser and Wilson (1999) noted that the development time/cost for online learning media can be up to five time more than the time/cost for traditional lectures.
One of the major setbacks of online teaching is the challenging nature of student engagement and faculty-student interactions (Clark, 2009). Students are more likely to lose interest in online classes than in traditional classroom learning environments (Ward & Newlands, 1998; Sanders, 2006). Making online classes more interactive and captivating may help improve student engagement, which may lead to higher learning outcomes.
Various combinations of text, graphics, audio, video and animations can be integrated into online courses. Media selection is very important because of the cost of developing different online instructional media (Sun & Cheng, 2007). Studies show that students' recall of information is higher when content is delivered with visual media. Abstract, new, and novel concepts are learned more easily when they are presented in both verbal and visual forms (Salomon, 1979). Empirical research indicates that visual media make concepts more accessible to people than text media and help with later recall (Cowen, 1984). Visual media may help students retain concepts and ideas. In online learning environments, learners and instructors are often separated by geographic and temporal distance, which trigger transactional distance (Moore, 1993). To mitigate such perceived distance, there must be a high degree of media richness (Mehrabian, 1969, 1981) to bridge this "distance," and achieve greater interactions in online environments. Therefore, students in online courses with greater media richness will experience lower transactional distance (Ekwunife-Orakwue & Teng, 2014; Adebowale, 2017).
The goal of this case study was to determine how different instructional media impacted student outcomes in an online toxicology course. Student outcomes were operationalized as engagements with course contents based on the PATHs Framework, and grades on assessments. Stakeholders often struggle to find an operational definition for online learning environments. For the purpose of this study, we used the operational definition of online learning by Allen and Seaman (2010), as shown in Table 1.
| Type of Course | Typical Description | Proportion of Content Delivered Online |
| Traditional Face-to-Face (TF2F) | No online technology is used and content delivery is via writing or orally. | 0% |
| Web Facilitated | A traditional F2F course supplemented/augmented with a web-based technology such as a Content Management System (CMS), or assignment- or syllabus-related web pages. | 1-29% |
| Blended/Hybrid | A hybrid of online and traditional F2F delivery; with more online meetings than F2F meetings. | 30-79% |
| Online | Most or all of the course and its content is delivered online, with no/negligible F2Fmeetings. | 80+% |
Source: Allen and Seaman (2010, p. 5) based on a survey of 2,500 Colleges and Universities.
The PATHs Framework Approach to measuring engagements with instructional media
The PATHs Framework (Adebowale, 2017) was used to measure the level of engagement of students with each instructional media. As shown in Table 2, student engagement can be measured by Posts, Access, Time, and Hits (PATHs) from learning analytics data stored in the course reports of Learning Management Systems (LMS). Blackboard Learn, the LMS used in this online course, generated nine course reports. Five of these reports were used as a measure of learning analytics for this course. They included user activity inside content areas, course activity overview (CAO), overall summary of user activity (OSUA), student overview for single course (SOSC), and user activity in forums (UAIF). These course reports contained both student-level data and course-level data. Based on the PATHs Framework, the learning analytics data generated from LMS course reports is a good measure of various learner interactions in an online environment, and can be summarized as comprising posts, hits, access, and time spent on content - together referred to as PATHs (Posts, Access, Time, and Hits).
Blackboard Learn LMS generates nine course reports for each course:
- All User Activity inside Content Areas (UAICA): displays a summary of all user activity inside the Content Areas for the course.
- Course Activity Overview (CAO): displays overall activity within a single course, sorted by student and date. Data includes the total and average time spent per active student and the total amount and type of activity each student had in the course. Optionally, you can filter the report by one or more groups.
- Course Coverage Report (CCR): displays goals coverage information for a single Blackboard Learn course. The data includes both covered and gap values for all curricular areas with which the course is associated, as well as a breakdown of course items that have been aligned to goals.
- Course Performance (CP): displays information showing how a single Blackboard Learn Course performs against a selected set of goals. Performance targets and the range of acceptable performances for the course can be determined when running the report. The data includes averages for the entire course as well as breakdowns for individual students and goals.
- Overall Summary of User Activity (OSUA): displays user activity for all areas of the course, as well as activity dates, times and days of the week.
- Single Course User Participation (SCUP): displays detailed statistics on assessment and collaboration tool submissions for all users in this course during a specified timeframe.
- Student Overview for Single Course (SOSC): displays an individual student's activity within a course, sorted by date. The data includes the total overall time the student spent in the course as well as detailed information about the student's activity, such as which items and Content Areas the student accessed, and the time spent on each.
- User Activity In Forums (UAIF): displays a summary of user activity in the Discussion Board Forums for the course.
- User Activity In Groups (UAIG): displays a summary of user activity in the Groups for the course.
| PATHs Categories | Learning Analytics Data from LMS |
| POSTs |
|
| ACCESS |
|
| TIME |
|
| HITs (some LMS course reports provide number of hits as clicks) |
|
Source: PATHs Framework (Adebowale, 2017).
Research questions
- What type of instructional media is most successful at helping students understand course concepts as measured by outcomes on assessments?
- Narrated PowerPoint Presentation
- PowerPoint Presentation without narration (PowerPoint slides)
- Online YouTube videos
- Shaky Hand videos
- What instructional media leads to the highest level of student engagement based on the PATHs Framework?
- What is the relationship between Posts, Access, Time, and Hits (PATHs) in the course and student outcomes on assessments?
Hypothesis
- Shaky Hand video can help students better understand course concepts than the other forms of instructional media used in the course. Therefore, student outcomes will be higher for concepts taught with Shaky Hand video than concepts taught with other types of instructional media. This is because of its high degrees of media richness, rich visual media, and the perceived feeling of "closeness" that users experience. The second highest student outcomes will be observed for Narrated PowerPoints, then YouTube videos, and finally PowerPoint slides. This sequence is conjectured since students may relate better with media featuring the voice of a familiar instructor (such as Shaky Hand video and Narrated PowerPoint) compared to text-rich media with nonverbal communication such as PowerPoint slides.
- YouTube and Shaky Hand videos would have the highest number of student engagement because of their high degree of media richness and visual media. Therefore, higher PATHs will be observed for YouTube and Shaky Hand videos compared to other instructional media.
- There will be a direct and positive relationship between PATHs and student outcomes on assessments.
Study context
Description of the Environmental Toxicology online course
The Environmental Toxicology course used in this study was offered through Blackboard Learn LMS. Students learn about the effects of chemical and physical agents on the health of the public and environment. They particularly study the transport of pollutants, chemical behavior, and biochemical mechanisms of the adverse health effects from environmental pollutants. Different instructional media were incorporated into the online course and were available for students to access throughout the semester. The instructional media included Narrated PowerPoint, PowerPoint slides, Shaky Hand videos and YouTube videos. Statistical tracking was enabled and used to generate the Blackboard Learn course reports at the end of the semester.
Participants
The data for this study was obtained from graduate students enrolled in an online environmental toxicology class in the fall of 2018. The course originated from the public health program at the University of Illinois, Springfield, and its duration was 15 weeks. The sample population comprised 15 students (60% female and 40% male students).
Course assessment
The students enrolled in the Environmental Toxicology course were assessed in a variety of ways, including quizzes, exams, discussion board posts, and term papers. The assessments can be categorized into two types: formative and summative.
Formative assessment:
- Quizzes: at the end of each week, a timed, open-book quiz (comprising multiple choice and true/false questions) on the week's lecture and textbook contents was assigned on Blackboard Learn LMS. The aggregated grade from all quizzes was worth 30% of the final grade.
- Discussion board posts: participation was mandatory and "active," which is defined as "providing meaningful expression and well thought out answers to the discussion questions." Meaningful dialogue is participation where the posts answer the discussion question, response to posts from other students, and contribution to group discussions. This was worth 20% of the final grade.
Summative assessments:
- Exams: Two open-book exams were administered during the course of the semester. The first exam was comprehensive and comprised all the concepts that were taught before the midpoint of the semester. The second exam comprised all the concepts covered throughout the entire semester. Each exam was worth 15% of the final grade, with both exams worth 30% of the final grade.
- Final paper: the students were asked to select and write about a problem topic that was relevant to toxicology. Problem topics that were deemed relevant were preapproved by the instructor. The students were required to relate a historical perspective of the problem or issue, discuss how the problem or issue was recognized, identify the impact of the problem or issue on public or environmental health, explain how the problem or issue is being studied, and outline how the problem or issue is being addressed or controlled. The final paper was worth 20% of the final grade.
Course materials were posted weekly on Blackboard and the students were required to complete their weekly assignments by a specific date at the end of the week. Course reports were run at the end of the semester. Though nine course reports were generated, no data were generated for course coverage and course performance reports, since no course set goals or goal type were included in the course. All subjects completed an informed consent to participate in the study. No incentive was provided for subject participation.
Results and discussion
As described in the PATHs Framework, learning analytics data from the course reports can be categorized into course-level and student-level data. The data in this study only reflects course-level data.
| Week | Instructional media | Number of pre-quiz hits | Average Grade on Quiz Assessment | Number of post-quiz hits | |
| 2 | Chapter 1 Narrated PowerPoint | - | 9.00 | 35 | |
| 3 | Chapter 2 YouTube video (Bhopal gas tragedy) | - | 8.26 | 33 | |
| 4 | Chapters 3/4 PowerPoint slides | - | 9.06 | 39 | |
| 5 | Chapters 5/6 Shaky Hand video (Dose response) | - | 9.28 | 49 | |
| 6 | Chapters 7/8 PowerPoint slides | - | 9.25 | 56 | |
| 7 | Chapter 9 PowerPoint slides | 52 | 9.50 | 50 | |
| 8 | Chapter 10 PowerPoint slides | 84 | 9.00 | 37 | |
| Exam 1 | - | ||||
| 9 | Chapter 11 PowerPoint | 65 | 9.00 | 36 | |
| 10 | Chapters 12/13/14 Narrated PowerPoint | 107 | 8.48 | 68 | |
| 11 | Chapters 15/16/17 Narrated PowerPoint | 70 | 9.62 | 81 | |
| 12 | Chapter 19 PowerPoint slides | 63 | 9.4 | 97 | |
| 14 | Chapter 24 PowerPoint slides | 73 | 8.53 | 50 | |
| 15 | Chapter 25 PowerPoint slides | - | |||
| Exam 2 | - |
Source: LMS Course Reports on Hits on Instructional Media.
The maximum number of points that students could earn for each exam was 20. The weighted value of each exam to the final grade was 15%. Each quiz was worth a maximum of 10 points and contributed 20% to the final grade. As shown above, pre-quiz hits were hits observed before the due date of the quiz. Post-quiz hits were hits observed after the due date of the quiz. Week 1 was not included because it was an introductory week and was not graded. Week 13 was not included because it was the week for completing projects. Hits were not observed for Weeks 2 through Week 5 because data from Blackboard Learn LMS were purged from the server due to the 180-day limitation. The hits were collated weekly, and though some weeks covered two or three PowerPoint chapters, hits on all chapters counted as one hit and not two or three separate hits. Based on the data above, student hits were higher for Week 10 Narrated PowerPoint (107 hits) compared to any other form of instructional media. Week 10 also had the third highest post-quiz hits, but the second lowest average grade on quiz assessments (8.48 points). The Week 11 Narrated PowerPoint had the fourth highest pre-quiz hits (70 hits), the second highest post-quiz hits (81 hits), and the highest average grade on quiz assessments (9.62 points). Overall, students performed better on quiz assessments for which Narrated PowerPoint was used for instructional delivery compared to other forms of media.
| Week | Type of Instructional media | Total Number of Weekly Hits on Course Content | Average Grade on Quiz Assessment |
| 2 | Narrated PowerPoint | 1393 | 9.00 |
| 3 | YouTube video | 1391 | 8.26 |
| 4 | PowerPoint slides | 1397 | 9.06 |
| 5 | Shaky Hand video (Dose response) | 1407 | 9.28 |
| 6 | PowerPoint slides | 1414 | 9.25 |
| 7 | PowerPoint slides | 1459 | 9.50 |
| 8 | PowerPoint slides | 1447 | 9.00 |
| Exam 1 | |||
| 9 | PowerPoint slides | 1260 | 9.00 |
| 10 | Narrated PowerPoint | 1221 | 8.48 |
| 11 | Narrated PowerPoint | 1062 | 9.62 |
| 12 | PowerPoint slides | 1022 | 9.4 |
| 14 | PowerPoint slides | 757 | 8.53 |
| 15 | PowerPoint slides | 590 | |
| Exam 2 | |||
Source: authors' own study.
Source: LMS Course Reports User Activity Inside Content Areas.
Source: LMS Course Reports User Activity Inside Content Areas.
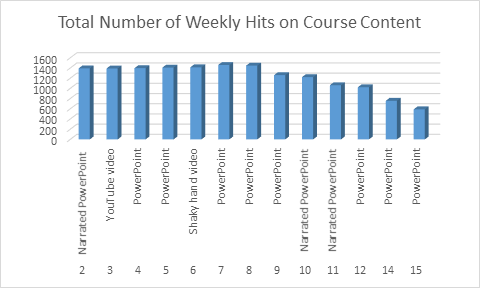
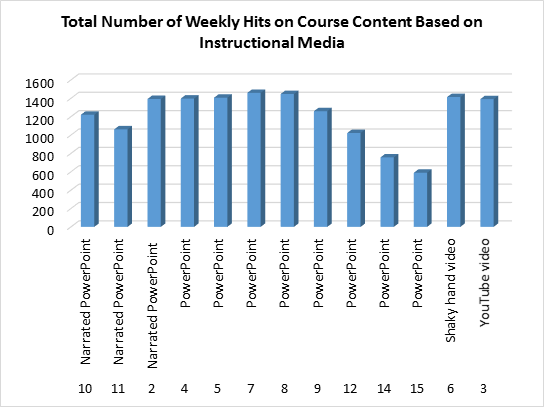
The Total Number of Weekly Hits on Course Content was used to measure student engagement with the instructional media. As shown above, there was no direct correlation between the type of instructional media and weekly hits on course contents (Figure 2), since the overall trend was a decrease in hits through the semester (from 1400 hits in week 2 to 590 hits in week 15) (Figure 1). This is consistent with previous findings described in Adebowale (2017), which showed that student engagement level, as measured by the number of hits, often declines as the semester progresses. Strategies are needed to sustain the same student-engagement levels that are observed in the first half of the semester (Table 4). An important observation is the low level of hits based on PowerPoint instructional media compared to the other forms of media.
| Week | Type of Instructional media | Total Number of Weekly Hits on discussion board forum | Total number of weekly posts on discussion board forum | Average Grade on Quiz Assessment |
| 2 | Narrated PowerPoint | 190 | 21 | 9.00 |
| 3 | YouTube video | 296 | 26 | 8.26 |
| 4 | PowerPoint slides | - | - | 9.06 |
| 5 | Shaky Hand video (Dose response) | 267 | 34 | 9.28 |
| 6 | PowerPoint slides | - | - | 9.25 |
| 7 | PowerPoint slides | 222 | 34 | 9.50 |
| 8 | PowerPoint slides | - | - | 9.00 |
| Exam 1 | ||||
| 9 | PowerPoint slides | - | - | 9.00 |
| 10 | Narrated PowerPoint | - | - | 8.48 |
| 11 | Narrated PowerPoint | - | - | 9.62 |
| 12 | PowerPoint slides | - | - | 9.4 |
| 14 | PowerPoint slides | 757 | - | 8.53 |
| 15 | PowerPoint slides | 590 | - | - |
| Exam 2 | ||||
Source: authors' own study.
If student engagements are higher with media-rich instructional media such as Shaky Hand video and Narrated PowerPoint, then higher numbers of hits and posts should be expected during the weeks in which these media were used for instructional delivery. As shown above, prior to Exam 1, the discussion board forum with YouTube video had the highest number of hits (296 hits), followed by the forum with Shaky Hand video (267 hits), and then the forums with PowerPoint slides and Narrated PowerPoint with 222 hits and 190 hits respectively. This may be an affirmation of the media richness theory (Mehrabian and Ferris, 1967), which states that videos have higher media richness than media with nonverbal communications. Overall, this hypothesis of the current study was supported by this observation. The symbol "-" indicates the discussion board forum was not part of the week's activities). The high level of hits observed during weeks 14 and 15 may be due to students reviewing course contents for the final exam.
| Week | Type of Instructional media | Total time (T) spent on media in hours | Number of times Instructional Media was Accessed (A) | Average Grade on Quiz Assessment |
| 2 | Narrated PowerPoint | 0 | 36 | 9.00 |
| 3 | YouTube video | 0 | 39 | 8.26 |
| 4 | PowerPoint slides | 0 | 68 | 9.06 |
| 5 | Shaky Hand video (Dose response) | 0.01 | 79 | 9.28 |
| 6 | PowerPoint slides | 0 | 59 | 9.25 |
| 7 | PowerPoint slides | 0 | 34 | 9.50 |
| 8 | PowerPoint slides | 0 | 24 | 9.00 |
| 9 | PowerPoint slides | 0 | 27 | 9.00 |
| 10 | Narrated PowerPoint | 0 | 74 | 8.48 |
| 11 | Narrated PowerPoint | 0.05 | 68 | 9.62 |
| 12 | PowerPoint slides | 0 | 40 | 9.4 |
| 14 | PowerPoint slides | 1.4 | 28 | |
| 15 | PowerPoint slides | 0 | 27 |
Source: LMS Course Report Single Course Activity Overview (SCAO).
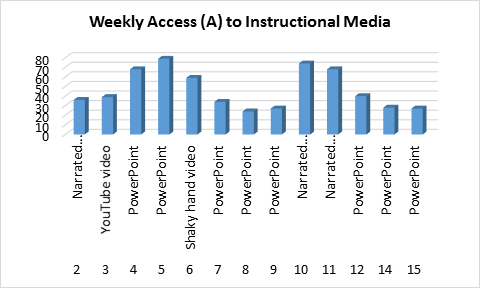
Partial data was obtained for time spent on each media. This may be due to the course report not capturing time spent below a certain threshold. The frequency of access (A) to each media showed higher access to Narrated PowerPoint (average Access = 59.33) and Shaky Hand video (Access = 79) compared to YouTube video (Access = 39) and PowerPoint slides (average Access = 38.38), which had the least access. Additionally, analytics on Access and Time for each media were not provided by running a course report of each media. Rather, they were obtained from the Single Course Activity Overview (SCAO) report. In some SCAO reports, analytics for Narrated PowerPoint and YouTube videos were not generated among other data; as a result, Access and Time were obtained from the content folder analytics.
Source: LMS Course Report Single Course Activity Overview (SCAO).
As shown in the Figure 3, there was no defined relationship between access to instructional media and the weeks. Unlike posts (P) and Hits (H) on weekly contents, which peaked during the first half of the semester and continuously declined for the rest of the semester, access (A) to instructional media showed no specific correlation with the weeks of the semester. A notable observation was the sudden increase in Access in Weeks 10 and 11, when Narrated PowerPoint was used, and the rapid decrease afterwards in Week 12 when PowerPoint slides were used. A limitation to this observation was the limited sample size used in this study, which make it difficult to compare the weekly contents; and hence its generalizability.

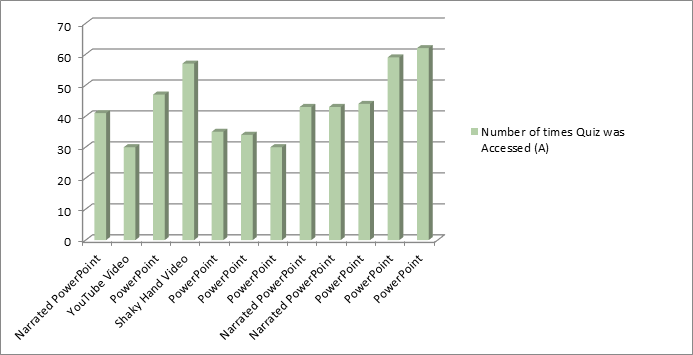
Source: LMS Course Report Single Course Activity Overview (SCAO).
As shown in figure 4, when the weeks of the semester were ordered based on the type of instructional media used, a pattern that emerged clearly showed that the average access (A) was the best approach to explaining the differences between the types of access to each form of instructional media.
| Week | Instructional media | Time (T) spent on Quiz Assessment (in hours) | Average Grade on Quiz Assessment |
| 2 | Chapter 1 Narrated PowerPoint | 7.5 | 9.00 |
| 3 | Chapter 2 YouTube video (Bhopal gas tragedy) | 7.84 | 8.26 |
| 4 | Chapters 3/4 PowerPoint | 18.55 | 9.06 |
| 5 | Chapters 5/6 Shaky Hand video (Dose response) | 11.33 | 9.28 |
| 6 | Chapters 7/8 PowerPoint | 14.18 | 9.25 |
| 7 | Chapters 9 PowerPoint | 8.9 | 9.50 |
| 8 and 9 | Chapters 10/11 PowerPoint | 9.84 | 9.00 |
| 10 | Chapters 12/13/14 Narrated PowerPoint | 15.33 | 8.48 |
| 11 | Chapters 15/16/17 Narrated PowerPoint | 12.72 | 9.62 |
| 12 | Chapter 19 PowerPoint | 7.58 | 9.4 |
| 14 | Chapter 24 PowerPoint | 9.63 | 8.53 |
| 15 | Chapter 25 PowerPoint | 10.41 | - |
Source: LMS Course Report Course Activity Overview (CAO).
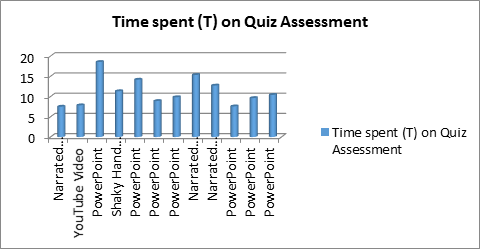
Quiz Assessments were based on open-book questions, and were available at the beginning of the week. Quizzes were given weekly. Each quiz had a force-completion requirement, i.e. the student must complete the quiz once it is deliberately opened. Each graded quiz assessment remained open for students to access and review during the course. Students with high PATHs on the instructional media were expected to spend less time on each weekly quiz assessment, since they should have mastered the concepts. In addition, students were expected to spend less time on quizzes that were based on content delivered with instructional media high in media richness compared to other forms of media. Table 7 shows the course-level data of total time spent on each quiz assessment by all students on the course.
Source: LMS Course Report Course Activity Overview (CAO).
As shown in Figure 5, the students spent less time (on average) on quiz assessments in which Narrated PowerPoint was used to deliver instruction compared to other forms of instructional media. YouTube video and Shaky Hand video had the next least times respectively. Quiz assessments in which PowerPoint slides were used to deliver instruction showed the highest time spent by students. Limitations to this observation include difficulty of the quiz, the number of chapters covered in the quiz, limited sample size, and other learner factors that could have contributed to the variance in performance.
| Week | Instructional media | Time (T) spent on Quiz Assessment (in hours) | Average Grade on Quiz Assessment |
| 2 | Chapter 1 Narrated PowerPoint | 41 | 9.00 |
| 3 | Chapter 2 YouTube video (Bhopal gas tragedy) | 30 | 8.26 |
| 4 | Chapters 3/4 PowerPoint slides | 47 | 9.06 |
| 5 | Chapters 5/6 Shaky Hand video (Dose response) | 57 | 9.28 |
| 6 | Chapters 7/8 PowerPoint slides | 35 | 9.25 |
| 7 | Chapters 9 PowerPoint | 34 | 9.50 |
| 8 and 9 | Chapters 10/11 PowerPoint slides | 30 | 9.00 |
| 10 | Chapters 12/13/14 Narrated PowerPoint | 43 | 8.48 |
| 11 | Chapters 15/16/17 Narrated PowerPoint | 43 | 9.62 |
| 12 | Chapter 19 PowerPoint slides | 44 | 9.4 |
| 14 | Chapter 24 PowerPoint slides | 59 | 8.53 |
| 15 | Chapter 25 PowerPoint slides | 62 |
Source: LMS Course Report Course Activity Overview (CAO).
As previously stated, Quiz Assessments were available at the beginning of each corresponding week. Students were only allowed to attempt the quizzes in one sitting; however, each graded quiz assessment remained open for students to access and review during the course of the semester. Since the mid-term and final exams were cumulative, students could access each quiz assessment while taking the exams. Based on the media richness of each instructional media, students were hypothesized to have lower access to quiz assessments on instruction in which instructional media with verbal communications were used (e.g. YouTube video, Shaky Hand video, and Narrated PowerPoint) compared to media with nonverbal communications (e.g. PowerPoint slides). This is based on the conjecture that instructional media with high media richness improves long term memory storage of information compared to media that has low media richness. Hence, students were expected to recall information faster, and therefore spend less time on quiz assessments with instruction based on instructional media with high media richness.
Source: LMS Course Report Course Activity Overview (CAO).
As shown in Figure 6, the students had the lowest access to quiz assessments in which instruction was delivered using YouTube video instructional media compared to other forms of instructional media. This may suggest that students recall better when instruction is delivered with YouTube video compared to other media. Instructions delivered with Shaky Hand video and PowerPoint had the highest access to quiz assessments; an indication of lower media richness. Narrated PowerPoint showed lower student access to quiz assessments; an indication that its media richness was higher than Shaky Hand video and PowerPoint.
Conclusions and implications
This study hypothesized that students would have high PATHs on instructional media with higher media richness, and that students were also expected to perform better on weekly quiz assessments based on instructions delivered with media that have higher media richness. Overall, Narrated PowerPoint had the highest PATHs and lowest quiz access, and more importantly the highest scores on assessments. YouTube video had the next highest PATHS, lower quiz access, but lower scores on assessments. Higher PATHs were observed with Shaky Hand videos compared to PowerPoint. These findings are consistent with both the transactional distance theory and media richness theory. The implication of these findings clearly shows the need for more instructional media with high media richness in online courses; specifically, environmental toxicology courses. Instructional media with high media richness mitigates the transactional distance experienced by learners and instructors in online environments. More importantly, lecture capture, as represented by Narrated PowerPoint media, is an important PATHs factor that influences student outcomes on assessments. This is consistent with the findings in Ekwunife-Orakwue (also known as 'Adebowale') and Teng (2014), which showed courses with lecture capture having the highest PATHs as measured by Learner-Content interaction, and also producing the greatest variance in student satisfaction in online and blended courses. Future studies would have to expand the number of courses used in the study, as well as the sample size of students group.
References
- Adebowale, K. (2017). Learner Analytics Patterns of Online Students' Interactions with Course Contents -Impacts on Student Outcomes, and Usefulness for Predictive Models to Optimize Student Outcomes in Online Courses in Blackboard Learn Learning Management System of Stony Brook University's School of Professional Development (Unpublished doctoral dissertation). Stony Brook University, Stony Brook, New York.
- Ekwunife-Orakwue (Adebowale), O., & Teng, T. (2014). The impact of transactional distance dialogic interactions on student learning outcomes in online and blended learning environments. Computers & Education Journal, 78, 414-427.
- Allen, I. E., & Seaman, J. (2010). Learning on Demand: Online Education in the United States, 2009. Retrieved from Sloan Consortium website http://sloanconsortium.org/publications/survey/pdf/learningondemand.pdf
- Allen, I.E., & Seaman, J. (2017). Digital Learning Compass: Distance Education Enrollment Report. Retrieved from Babson Survey Research Group website https://www.onlinelearningsurvey.com/reports/digtiallearningcompassenrollment2017.pdf
- Allen, I. E., & Seaman, J. (2017). Class Differences: Online Education in the United States, 2010. Retrieved from Sloan Consortium website http://sloanconsortium.org/publications/survey/class_differences
- Clark, R. E. (2009). Past and future research in online education. (Unpublished paper presented at the 2009 annual meeting of the American Education Research Association), San Diego, California.
- Cowen, P. S. (1984). Film and text: Order effects in recall and social inferences. Educational Communication and Technology, 32, 131-144.
- Mehrabian, A. (1969). Significance of posture and position in the communication of attitude and status relationships. Psychological Bulletin, 71(5), 359-372.
- Mehrabian, A. (1981). Silent messages: Implicit communication of emotions and attitudes. Belmont, CA: Wadsworth.
- Mehrabian, A., & Ferris, S. R. (1967). Inference of attitudes from nonverbal communication in two channels. Journal of Consulting Psychology, 31(3), 248-252.
- Moore, M. G. (1993). Theory of transactional di stance. In D. Keegan, (Ed.), Theoretical principles of distance education. New York: Routledge.
- Salomon, G. (1979). Interaction of media, cognition, and learning: An exploration of how symbolic forms cultivate mental skills and affect knowledge acquisition. San Francisco: Jossey-Bass.
- Sanders, R. (2006). The "imponderable bloom": Reconsidering the role of technology in education. Innovate: Journal of Online Education, 2(6). Retrieved from https://nsuworks.nova.edu/innovate/vol2/iss6/6/
- Sun, P.C., & Cheng, H.K. (2007). The design of instructional multimedia in e-learning: A media richness theory-based approach. Computers and Education, 49(3), 662-676. DOI: 10.1016/j.compedu.2005.11.016
- Ward, M., & Newlands, D. (1998). Use of the Web in undergraduate teaching. Computers and Education, 31(2), 171-184. DOI: 10.1016/S0360-1315(98)00024-4
- Weiser, M., &Wilson, R.L. (1999). Using video streaming on the Internet for a graduate IT course: A case study. Journal of Computer Information Systems, 39(3), 38-43.