Informacje o artykule
DOI: https://www.doi.org/10.15219/em107.1688
W wersji drukowanej czasopisma artykuł znajduje się na s. 47-53.
 Pobierz artykuł w wersji PDF
 Abstract in English
Jak cytować
Kolitsky, M. A. (2024). Study pace reveals differences in online learning using R-squared analysis. e-mentor, 5(107), 47-53. https://www.doi.org/10.15219/em107.1688
E-mentor nr 5 (107) / 2024
Spis treści artykułu
- Abstract
- Introduction
- Anatomy and Physiology I online lecture information
- Anatomy and Physiology I Online Lab Information
- Histology Online Course
- Conclusions
- Appendix A
- Appendix B
- Appendix C
- References
Informacje o autorze
Study pace reveals differences in online learning using R-squared analysis
Michael A. Kolitsky
Abstract
Highly-enrolled fully online lectures and laboratory classes in Anatomy and Physiology, and higher-level Histology courses, were used to calculate R-squared values that could be linked to how the study method chosen by students impacted their exam grades. Student performance on major exams containing only T/F and multiple-choice questions exhibited better exam results, as did the R-squared values for those who studied using tiny quizzes at a slow pace rather than those who studied with them at a fast pace, indicating that learning was done using the flashcard method. There was a difference in grade distribution, with a peak in the A category for the slow pace quiz group, to a peak in the B category for the fast pace group. The use of Respondus with Blackboard also permitted video observation of students following the submission of exams, which did not indicate that any major cheating efforts or use of AI had taken place during major exams. The lack of evidence for cheating or AI usage makes the observation of higher R-squared values from the slow-paced quiz method a significant factor in future online course design.
Keywords: retrieval practice, R-squared, Tiny Quizzes, online learning, grade distribution
Introduction
Previous work using R-squared analysis supported the use of practice quizzes as a form of retrieval practice pedagogy (Agarwal et al., 2021; Kolitsky, 2013). Retrieval practice uses small practice quizzes with questions taken from larger pools of questions covering the material to be learned, with questions from the chapters being covered in major lecture exams or labelled images from simulated microscopy for lab exams composed of True/False and multiple-choice questions provided and referred to as “Tiny Quizzes” or TQ’s (Kolitsky, 2020). Students’ results on major exams were found to be linked to the number of TQ’s done by using R-squared statistical analysis, which indicates how well data points fit a line (Fernando, 2024; Kolitsky, 2022). The use of R-squared analysis also showed that student use of Tiny Quizzes could be linked to how fast students studied, i.e. their study pace (Kolitsky, 2013). By using TQs, student results could be separated into a fast study group resulting in the quick download of TQ questions so that study could occur off-line in flash-card mode, and students who did the TQ questions online in a time significantly longer than students using TQs with a fast pace. R-squared analysis showed higher positive data results and better course grades for students who studied at a slower pace online using the online testing programme provided by Blackboard ULTRA (Blackboard, n.d.) coupled with the Respondus video capture technology, as opposed to the results found for students who did the TQs at a fast pace with studying taking place outside the course using flash cards.
Students’ course results are also of significance with the emergence of ways to cheat with ChatGPT or other AI alternatives, and student performance in the autumn 2023 semester is being viewed as a way to provide feedback about any widespread effort to cheat on future exams taken in an entirely online environment. Respondus software prohibits the opening of other programmes during an exam, and also keeps copies of the observed video of the student taking an exam (Respondus, n.d.) so that further analysis of that video can be studied to ascertain that no cheating by using other computers or paper copies of the material being tested are available. Three courses (Anatomy and Physiology I lecture, Anatomy and Physiology I lab and Histology) offered fully online during the autumn 2023 semester were analysed for the impact of the pace of study used by students before taking their major exams, and the effect of that pace of study on the grades received for those exams.
Anatomy and Physiology I online lecture information
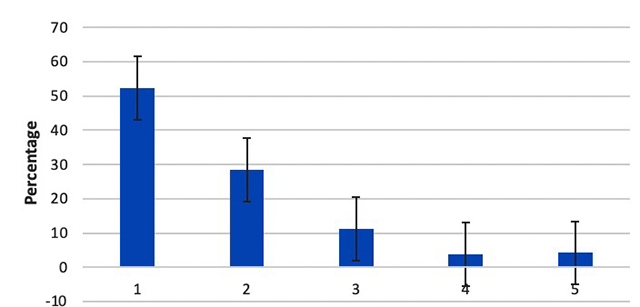
In Figure 1 below, the grade distribution for the autumn 2023 Anatomy and Physiology lecture course with 235 enrolled students is shown, and is typical of grade distributions for the previous three years for the same course offered under similar conditions. Videos of students taking the exam were captured by use of Respondus software and showed no evidence of cheating during the course in the fully online mode.
Figure 1
Grade Distribution for AP Lecture – Fall 2023

Source: author’s own work.
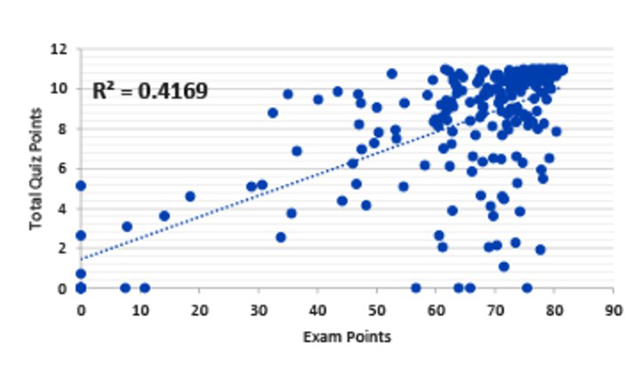
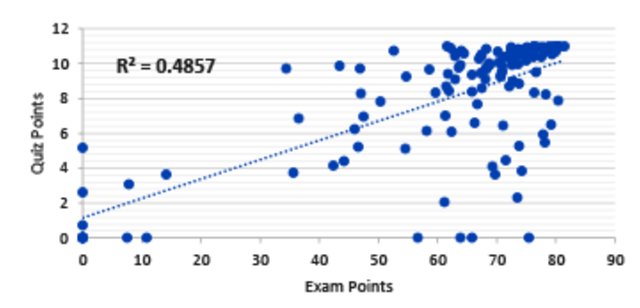
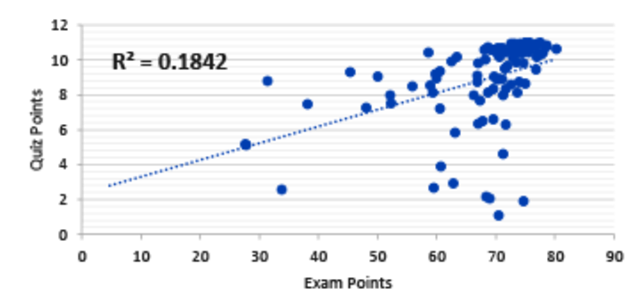
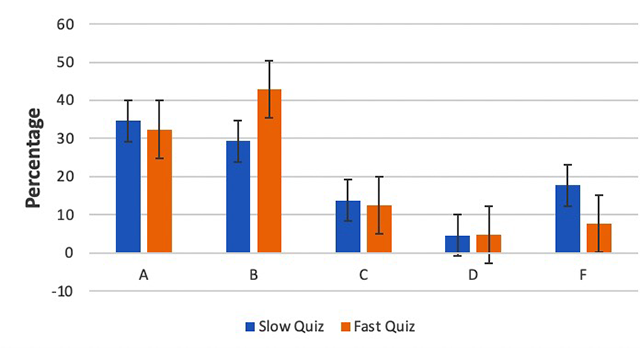
In order to encourage the use of Tiny Quizzes (TQs) in the retrieval practice mode of study, some small amount of credit was assigned to using TQs a minimum of 10 times, and then for each following five TQs. Figures 2a, 2b and 2c below were used to study and compare the tightness of fit as indicated by the calculation of R-squared values for the total TQ point scores and the actual exam results generated for those TQ values, which showed an interesting phenomenon linked to the way that students use the retrieval practice learning strategy that emerges from how much time they spend doing the quizzes in the retrieval practice mode. It was found that some students take their time with the practice TQs, labelled in Figure 2b as “Slow Pace Per Quiz”, compared to the results in Figure 2c, labelled as “Fast Pace Per Quiz”, and which includes those TQ scores for students who spend very little time doing the first 10 TQs before doing the next five TQs for credit. Feedback from emails sent to students indicated that students who quickly downloaded the first 10 sets of TQ questions and were included in the “Fast Pace Per Quiz” category were downloading TQ files and using them for study using the flash card method, i.e. shuffling downloaded physical cards and then studying them as they appear in order from a shuffled stack. Surprisingly, the calculation of points earned for these two methods of study differed significantly, as seen in Figure 3 below, in which the grade distribution for students using the Fast Quiz study method shifted to the lower grade category and now showed a peak in the B region. In this case, the R-squared analysis proved essential in clarifying the best study method for learning the lecture material being tested.
Figure 2a
R-squared Analysis of AP Lecture – Autumn 2023
Source: author’s own work.
Figure 2b
R-squared Analysis of AP Lecture – Autumn 2023, Slow Pace Per Quiz
Source: author’s own work.
Figure 2c
R-squared Analysis of AP Lecture – Autumn 2023, Fast Pace Per Quiz
Source: author’s own work.
Figure 3
AP Lecture Grade Distribution – Slow versus Fast Quiz
Source: author’s own work.
Anatomy and Physiology I Online Lab Information
Figure 4 below shows the grade distribution for the autumn 2023 Anatomy and Physiology lab course enrolling 177 students, and the grade distribution is similar to that found for the previous three years for lab courses offered under similar conditions. Respondus was used to capture a video of students taking the exam, with the video showing no evidence that cheating or the use of AI was being employed in the offering of this fully online lab course.
Figure 4
Grade Distribution for AP Lab – Fall 2023

Source: author’s own work.
Figure 5 below studies the tightness of fit for the R-squared values obtained for the Quiz scores generated while studying for the exam with the exam points earned from doing the lab exams. Appendix A contains two additional graphs further supporting that the pace of study of the Tiny Quizzes impacted the measured performance of students taking the lab exams. Those graphs show a calculated R-squared value of 0.4563 for exams taken by students studying at a slow pace versus an R-squared value of 0.2179 calculated for students studying for the exam at a fast pace.
Figure 5
R-squared Analysis of AP Lab – Autumn 2023

Source: author’s own work.
The pace at which the Quizzes were done also impacted the lab grade distribution, as seen in Figure 6, which shows a decrease in A grades and an increase in B grades when Quizzes were done at a fast or rapid pace.
Figure 6
AP Lab Grade Distribution – Slow versus Fast Quizzes

Source: author’s own work.
Histology Online Course
It is important to point out that the higher-level Histology course was offered with both the lecture material and the lab component in the same course, i.e. the lab portion was not offered separately from the lecture material.
Figure 7 below shows the grade distribution for the autumn 2023 Histology course enrolling 177 students, and the grade distribution is similar to that found for the previous three years for courses offered under similar conditions. Respondus was used to capture a video of students taking the exam and showed no evidence that cheating or the use of AI was used in this fully online lecture and lab course.
Figure 7
Grade Distribution for Histology Lecture, Autumn – 2023

Source: author’s own work.
R-squared analysis of the Histology lecture grades collected for the entire class is shown in Figure 8. Appendix B contains two additional graphs for the Histology lecture, which further support that the pace of study of the Quizlets had an impact on the measured performance of students taking the lecture exams. These graphs show a calculated R-squared value of 0.298 for exams taken by students studying at a slow pace versus an R-squared value of 0.1036 calculated for students studying for the exam at a fast pace.
Figure 8
R-squared Analysis of Histology Lecture – Autumn 2023

Source: author’s own work.
It is also of interest to see in Figure 9 that the grade distribution differed for the students based on their choice of study, in which it can be seen that the slow study group (blue bars) showed a grade distribution that increased in percentage toward the A category, but the fast study section (orange bars) showed a peak in the B category.
Figure 9
Grade Distribution – Slow versus Fast Quizzes

Source: author’s own work.
The grade distribution shown in Figure 10 for the lab component also appeared normal for the autumn 2023 course when compared to grade distributions from previous years.
Figure 10
Grade Distribution Histology Lab, Autumn – 2023
Source: author’s own work.
A similar pattern was observed in a comparison for R-squared values where exam scores were compared between groups using the slow study method and those students using the fast study method. The R-squared value for the entire class is seen in Figure 11, and Appendix C contains the R-squared graphs and values obtained for both the slow Quiz time and the fast Quiz completion times. The R-squared values were higher for students studying Quizzes at a slower pace when compared to that found for students studying Quizzes at a fast pace.
Figure 11
Histology Lab Exam – All Quizzes

Source: author’s own work.
In Figure 12 below, the grade distribution for slow versus fast study pace was higher, but the peak in the B category observed for the lecture lab component was not found for the lab data. Observations and analysis of Respondus videos collected during the exam sections did not show any observable signs of cheating or AI usage. The slow versus fast differences to studying for the lab exams, which focused more on identifying structures and cell patterns in images, may indicate that studying images with labels may not be as sensitive to the speed of studying phenomena observed for the Anatomy and Physiology lab exam. Histology is also a higher-level class for Biology majors who may be more experienced in the study of cell and tissue images, which might result in less of a difference in the slow versus fast observed phenomenon in the Anatomy and Physiology lab.
Figure 12
Grade Distribution – Slow versus Fast

Source: author’s own work.
Conclusions
It is of interest that the successful study of material – textual and image-based, can be affected by the speed taken to complete the tiny quizzes, i.e. the pace of study, designed to assist students in learning the material that must be mastered to do well on the larger exams. Each of the tiny quizzes used for study were offered with a small amount of credit, for example 0.5% of the final grade calculations, to encourage their use in the study effort. And, to further place the quantitative monitoring on an easy schedule for grading, students were told that the first 10 quizzes done constituted an entry into the points earned category, so that then the next five tiny quizzes done, i.e. quizzes 11–15, counted for credit, with 0.5 points out of the possible 100 points to be earned for the course grade. Once the first set of 10 tiny quizzes was done, then the next five or even more than that, for example, quizzes 16–20 or 22–26, could be done until the student felt they had mastered the material. But it was always the last five tiny quiz scores after doing a minimum of 10 that counted for credit for that particular tiny quiz. This method of waiting for at least 10 tiny quizzes to be done before doing quizzes that counted for credit may have been the reason for two ways of earning quiz credits emerging, since some students just opened and then quickly closed the first 10 quizzes, so that the next five would now be in the category where credit could be earned. The students who did the first 10 quizzes quickly were the ones categorised as the fast-paced quiz takers, while the students who took their time to do the quizzes in the first 10 category were the ones who on average did significantly better when taking the major exams for the lecture or lab. It is also of interest that the differences observed between the slow and fast-paced quiz takers seem to focus on how slowly each group did the first 10 quizzes, which did not count for credit, but was likely a way that better cemented what was needed to be learned to do well on the major exams for which the students were studying.
One of the main lessons learned from this study is that retrieval practice is an important method to learn what will be tested, but by itself, it is only a first step toward understanding the role and importance of pacing in the process of learning material to be tested. When the pace of study time was compared, there was a clear distinction between students who paced their study by using the tiny quizzes as delivered inside the course compared to those who studied the same material, but downloaded and mastered outside the course. The message guiding teachers is that R-squared calculation of retrieval practice results based on the time devoted to the pace of study is an important way to determine how well students know the material being tested. And there is also a message aimed for, and also guiding, students in this process, as they will now have a better understanding of how to pace and design their own study efforts in learning the material to be tested.
Exactly how much this phenomenon of slow-pace quiz studying can be more productive for learning than fast-pace quiz studying is transferable to other courses where more than T/F or multiple-choice questions are used to assess what is learned still needs to be studied. For the courses in this study, the material covers vocabulary and the definitions of words that describe the structure and/or function of the cells and organs making up the human body. Courses in other disciplines, in which a certain vocabulary must first be mastered before functional or higher-level conclusions are discussed, may find the slow pace of learning to be of value when designing questions for study purposes.
Appendix A
Figure 5a
R-squared Analysis of AP Lab – Autumn 2023, Slow Time Per Quiz

Source: author’s own work.
Figure 5b
R-squared Analysis of AP Lab – Autumn 2023, Fast Time Per Quiz

Source: author’s own work.
Appendix B
Figure 8a
R-squared Analysis Histology Lecture – Autumn 2023, Slow Time Per Quiz

Source: author’s own work.
Figure 8b
R-squared Analysis Histology Lecture – Autumn 2023, Fast Time Per Quiz
Source: author’s own work.
Appendix C
Figure 11a
Histology Lab Exam – Slow Quiz
Source: author’s own work.
Figure 11b
Histology Lab Exam – Fast Quiz
Source: author’s own work.
References
- Agarwal, P. K., Nunes, L. D., & Blunt, J. R. (2021). Retrieval practice consistently benefits student learning: A systematic review of applied research in schools and classrooms. Educational Psychology Review, 33(4), 1409-1453. https://doi.org/10.1007/s10648-021-09595-9
- Blackboard. (n.d.). What is “Ultra”? Retrieved May 27, 2024, from https://help.blackboard.com/Learn/Student/Ultra/Getting_Started/What_Is_Ultra
- Fernando, J. (2024). R-Squared: Definition, calculation, and interpretation. Investopedia. https://www.investopedia.com/terms/r/r-squared.asp
- Kolitsky, M. A. (2013). Teaching anatomy online using retrieval practice, 3D stereoscopic images and virtual human fly-through videos. FASEB Journal, 27(S1). https://faseb.onlinelibrary.wiley.com/doi/abs/10.1096/fasebj.27.1_supplement.960.28
- Kolitsky, M. A. (2020). Retrieval practice enhances online learning in academic courses. e-mentor, 2(84), 47-53. https://doi.org/10.15219/em84.1464
- Kolitsky, M. A. (2022). Use of retrieval practice data as a learning analytics tool. FASEB Journal, 36(S1). https://doi.org/10.1096/fasebj.2022.36.S1.L7427
- Respondus. (n.d.). LockDown Browser. Prevent cheating during online exams. Retrieved May 22, 2024, from https://web.respondus.com/he/lockdownbrowser/

 https://orcid.org/0000-0002-9796-154X