Informacje o artykule
DOI: https://www.doi.org/10.15219/em107.1681
W wersji drukowanej czasopisma artykuł znajduje się na s. 20-28.
 Pobierz artykuł w wersji PDF
 Abstract in English
Jak cytować
Karsak, E. E, & Ucar, E. (2024). Education policy assessment of countries using an integrated decision-making approach. e-mentor, 5(107), 20-28. https://www.doi.org/10.15219/em107.1681
E-mentor nr 5 (107) / 2024
Spis treści artykułu
- Abstract
- Introduction
- Evaluation Based on Distance from Average Solution Method
- Best-Worst Method
- Educational performance assessment of countries
- Discussion
- Summary and concluding remarks
- References
Informacje o autorach
Education policy assessment of countries using an integrated decision-making approach
E. Ertugrul Karsak, Ece Ucar
Abstract
As governments strive to provide flawless and unbiased education to students while using resources in an efficient and sustainable manner, assessing countries' educational performance has become a prevailing topic, and the rising relevance of achieving this aim encourages the use of multi-criteria decision-making (MCDM) tools. This article presents an integrated approach using the Evaluation Based on Distance from Average Solution (EDAS) method in combination with the Best-Worst Method (BWM) to compare the educational performance in European Union member states. The performance assessment criteria are derived from the Programme for International Student Assessment (PISA) 2018 database and the UNESCO Institute for Statistics 2018 database. The research takes into account not only PISA test results but also further crucial features, including the teachers/students ratio, learning time, and government expenditure on primary education as a proportion of GDP, with the criteria weights computed using the linear version of BWM. The proposed approach, which uses EDAS in combination with BWM weights, produces a complete ranking of the evaluated EU nations, and also determines the best-performing country in terms of education. In order to illustrate the robustness of the proposed decision framework, a comparative analysis of the obtained rankings with the outcomes of other well-established distance-based MCDM methods is provided.
Keywords: educational performance of countries, performance assessment, MCDM, Best-Worst Method, EDAS
Introduction
Governments set forth educational policies to uphold the goal of creating more effective and equitable educational systems, as proposed by the United Nations Development Programme (UNDP) in September 2015, which aims to ensure "inclusive and equitable quality education for all" (OECD, 2019). The Organisation for Economic Cooperation and Development (OECD) is in charge of generating statistics on the metrics that represent Sustainable Development Goal (SDG) 4, and the Programme for International Student Assessment (PISA) is a key instrument promoting these efforts by advancing indicators, and thereby assessing progress toward SDG 4 attainment.
PISA, a triennial assessment of international education systems established in collaboration with the OECD, delivers significant information regarding the achievements of 15-year-old students in PISA tests and the factors that impact the education quality of students to measure the educational performance of countries. PISA primarily publishes student test scores in reading, mathematics and science, as well as various indications and indices demonstrating students' educational resources, and social, economic and cultural circumstances (OECD, 2019).
Education is regarded as a significant pillar of the knowledge economy under the World Bank Knowledge Assessment Methodology (KAM) (Amavilah & Rodriguez Andrés, 2022). As a result, the evaluation of nations' educational performance may be used as a tool to track national progress in boosting the knowledge economy, and the development of the knowledge economy and the widespread acceptance of PISA as a worldwide benchmark have drawn attention from around the world for reforming educational systems, and there even exists a significant link between PISA and the economic progress of nations. In their study, Hanushek and Woessmann (2020) showed that enhancing student performance by 25 PISA points across the EU would provide €71 trillion in present value to the EU's Gross Domestic Product (GDP) compared to the current situation. Another noteworthy aspect of PISA worth mentioning is that the evolving methods of educational governance in schools are affected by PISA within the context of the rising spatialities of globalisation (Lewis & Lingard, 2022).
Multi-criteria decision making (MCDM) has been used in certain works to assess and compare the performance of schools and/or countries using PISA data. Stamenković et al. (2016) evaluated Serbian secondary schools using the ELECTRE multi-level outranking (ELECTRE MLO) method and PISA data, while Aparicio et al. (2018) used the non-radial Data Envelopment Analysis (DEA) model to compare the academic performance of 34 nations using PISA 2012 datasets, and using PISA data from the years 2006–2018, Aparicio et al. (2022) compared the academic performance of Latin American nations. The Best-Worst PROMETHEE method was proposed by Ishizaka & Resce (2021) to analyse the performance of the 66 countries that took part in the PISA survey using three indicators, including reading, maths and science scores. Ucar and Karsak (2021) used common-weight DEA-based models, along with PISA 2018 data, to conduct a comparative analysis of countries within the OECD.
This study compares the educational performance of EU member states using an integrated decision methodology based on the Evaluation Based on Distance from Average Solution (EDAS) method. Developed by Keshavarz-Ghorabaee et al. (2015), this method is an MCDM approach that assesses the alternatives by computing the positive distance from the average solution (PDA) and negative distance from the average solution (NDA). As opposed to other methods, such as TOPSIS (Technique for Order of Preference by Similarity to Ideal Solution) and VIKOR, which use the distance to the ideal and anti-ideal solutions, EDAS uses the distance to the average solution. Higher values of PDA and/or lower values of NDA denote that the alternative is preferred to the average solution. In comparison to outranking methods, such as ELECTRE and PROMETHEE, which evaluate the preferences between each pair of alternatives (Gebre et al., 2021), the EDAS method is a distance-based MCDM method that assesses alternatives according to their positive and negative distances to the average solution.
As the EDAS method is dependent on weighted criteria values, it is crucial to use an appropriate weighting method. There are a number of weighting methods delineated in the literature that may be categorised into two primary groups as subjective weighting and objective weighting approaches. The well-known subjective weighting methods comprise the Analytic Hierarchy Process (AHP) (Saaty, 1977), the Analytic Network Process (ANP) (Saaty, 2004), the Delphi method (Hwang & Lin, 1987), the stepwise weight assessment ratio analysis (SWARA) (Keršuliene et al., 2010), and the factor relationship (FARE) (Ginevicius, 2011). Although these techniques help to reflect the opinions of experts, the consistency of pairwise comparisons must be justified for a sound evaluation. The entropy method (Shannon, 1948), the LINMAP method (Srinivasan & Shocker, 1973), and mathematical programming-based techniques (Pekelman & Sen, 1974) are objective weighting methods.
The Best-Worst Method (BWM) is used in this study to determine the criteria weights for the educational performance assessment. Introduced by Rezaei (2015), it is one of the lately proposed methods for weighting criteria, and is a comparison-based method that possesses two merits, namely demanding fewer comparisons, which are also relatively more consistent. The AHP requires n(n-1)/2 pairwise comparisons to determine the weights of criteria, where n denotes the number of criteria. However, as determining the preference of the best criterion over the remaining criteria and the preference of all other criteria over the worst criterion are sufficient to calculate the weights of criteria in BWM, only (2n-3) comparisons are performed. Rezaei (2015) also demonstrated with numerical examples that BWM yields more consistent comparisons than AHP. In this study, BWM designates criteria weights to be used in the EDAS method, which will be used to evaluate the educational performance of EU member states.
The remaining sections of the manuscript are organised as follows. The fundamentals of the EDAS method are presented in the following section, while the steps of BWM are explained in the subsequent section, followed by a case study concerning the evaluation of educational performance in EU nations using the proposed integrated decision approach. The results of the analysis are then compared with those of other widely used distance-based MCDM methods, with a summary and conclusions provided in the final section.
Evaluation Based on Distance from Average Solution Method
Evaluation Based on Distance from Average Solution (EDAS) is an MCDM technique initially proposed by Keshavarz-Ghorabaee et al. (2015) that assesses alternatives by computing the positive distances and the negative distances from the average solution. EDAS is viewed as a valuable approach where the decision-maker is faced with opposing criteria (Keshavarz-Ghorabaee et al., 2015). In MCDM techniques such as TOPSIS and VIKOR, which propose compromise solutions, the best solution is determined by computing the alternatives' distance from the ideal solution and the anti-ideal solution (Keshavarz-Ghorabaee et al., 2015). According to these methods, the best alternative is deemed to be near to the ideal solution and farther from the anti-ideal solution, whilst in EDAS, alternatives are assessed employing the positive distance from average (PDA) and the negative distance from average (NDA) measures. The alternative solution is deemed to be superior to the average solution when there are higher values of PDA and/or lower values of NDA. Considering m alternatives to be assessed based on n criteria, the eight stages of the method are provided below.
(1) Determine the set of criteria that are essential for assessing alternatives.
(2) Establish the decision matrix X given below, considering m alternatives and n criteria.

Here, xij is the performance value of alternative i with respect to criterion j.
(3) Compute the average solution for each criterion as

where

Here, AVj, which represents the average solution for criterion j, is calculated as the average of column j of the decision matrix X.
(4) Determine the positive distance from the average (PDA) and the negative distance from the average (NDA) matrices taking into account the benefit and cost criteria, respectively as


If criterion j is a benefit criterion, then


If criterion j is a cost criterion, then

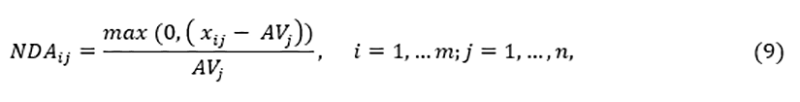
where PDAij and NDAij denote positive and negative distances from the average solution for the ith alternative for the jth criterion, respectively. Here, xij indicates the performance value of alternative i regarding criterion j, and AVj denotes the average solution for criterion j.
(5) Determine the weighted sum of PDA and NDA for each alternative as follows:


where wj is the weight of criterion j. SPi represents the weighted sum of PDAij values, and SNi denotes the weighted sum of NDAij values.
(6) Determine the normalized values of SPi and SNi for each alternative as shown below.


NSPi and NSNi represent the normalized values of SPi and SNi, respectively.
(7) Calculate the appraisal score (AS) for each alternative as

where 0 ≤ ASi ≤ 1.
The appraisal scores for the alternatives are computed as the arithmetic mean of NSPi and NSNi.
(8) Rank the alternatives for the appraisal scores (AS) in decreasing order. The alternative possessing the highest AS is determined as the best performer among the set of alternatives.
Best-Worst Method
In the case of MCDM problems, the degree of importance of the criteria is crucial for their appropriate consideration while evaluating the alternatives. BWM, which is a comparison-based approach, is regarded as an efficient technique that produces fewer and more consistent comparisons (Rezaei, 2015). n(n-1)/2 pairwise comparisons are conducted in AHP to determine the weights of criteria, with n denoting the number of criteria. In BWM, however, only (2n-3) comparisons are necessary, since identifying the preference of the best criterion over the remaining criteria and the preference of all other criteria over the worst criterion is adequate to generate a set of criteria weights. Rezaei (2015) supported the argument that BWM yields more consistent comparisons than AHP with various numerical illustrations. The stepwise procedure of BWM is delineated below.
(1) Identify n criteria for assessing alternatives.
(2) Determine the best (i.e. most desirable or most important) and the worst (i.e. least desirable or least important) criteria.
(3) Indicate the preference of the best criterion over the remaining criteria, using a scale of 1 to 9. The best-to-others (BO) vector is

where aBj represents the preference of the best criterion (B) over criterion j.
(4) Indicate the preference of all other criteria over the worst criterion, using a scale of 1 to 9. The others-to-worst (OW) vector is obtained as

where ajW denotes the preference of criterion j over the worst criterion (W).
(5) Determine the optimal weights for n criteria (w1*, w2*, ..., wn*).

Formulation (17) is akin to the model given below.
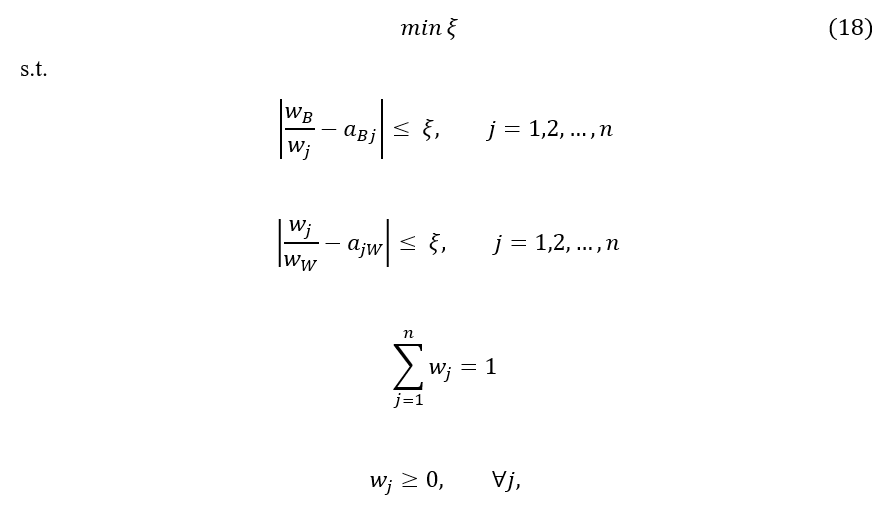
where the optimal weights of the criteria are obtained by minimising the maximum of the absolute differences  for all criteria. Rezaei (2016) demonstrated that formulation (18) can yield multiple optimal solutions, leading to the introduction of the following model for BWM.

Accordingly, formulation (19) is transformed to the linear model given below.

In the linear model of BWM, ξL is deemed as an indicator of the consistency of the comparisons, with a value of ξL close to zero preferred.
Educational performance assessment of countries
Throughout this section, an integrated approach based on the EDAS method is used to assess the educational performance of twenty EU member states for which complete data for the considered criteria could be obtained. The PISA 2018 database and the UNESCO Statistics Institute database are used to determine the performance values of countries with regard to specified criteria. Throughout the analysis, reading, mathematics and science PISA test scores, as well as the ratio of teachers to students, learning time of students (in minutes per week), and government expenditure on primary education as a percentage of GDP are considered as performance criteria. The government expenditure on primary education as a percentage of GDP in 2018 is derived from the UNESCO Institute for Statistics database (UNESCO, 2018), whereas the other indicators are obtained from the PISA 2018 database (OECD, 2018). As the government expenditure on primary education has already been used with PISA test scores for performance evaluation in the relevant literature, this criterion is selected in lieu of government expenditure on secondary education (Kocak et al., 2019). Furthermore, according to Gupta et al. (2002), the reason that governments attach more importance to the expenditure on basic education is based on the social rate of return, with previous research conducted for evaluating the effectiveness of government spending on education revealing that the social rate of return is highest for primary education, succeeded by secondary and tertiary education (Psacharopoulos, 1994). According to the PISA database, the learning time of students indicates the total amount of learning time of students in their schools.
Table 1 contains information pertinent to the education performance evaluation of 20 countries according to six criteria.
The weights of criteria are calculated using formulation (20), i.e. the linear form of BWM. Table 2 displays the best-to-others (BO) and other-to-worst (OW) vectors of BWM derived from field experts’ evaluation, which indicate the preference of the best criterion over all others and the preference of all others over the worst criterion, respectively. According to the outcomes of BWM, the mathematics score is regarded as the best (i.e. most important) criterion, whereas the learning time is regarded as the worst (i.e. least important) criterion. The linear form of BWM has a consistency indicator, ξL, of 0.071, which can be considered as acceptable. Table 3 displays the weights of criteria computed using the linear form of BWM.
Table 1
Data concerning the educational performance assessment of EU countries
| EU countries | reading score | math score | science score | teachers/students ratio | learning time | government expenditure (%) |
| Austria | 484.393 | 498.942 | 489.780 | 0.092 | 1730 | 0.893 |
| Belgium | 492.864 | 508.070 | 498.773 | 0.108 | 1669 | 1.524 |
| Czechia | 490.219 | 499.468 | 496.791 | 0.077 | 1536 | 0.845 |
| Denmark | 501.130 | 509.398 | 492.637 | 0.074 | 1655 | 1.632 |
| Estonia | 523.017 | 523.415 | 530.108 | 0.081 | 1563 | 1.470 |
| Finland | 520.079 | 507.301 | 521.885 | 0.092 | 1479 | 1.349 |
| France | 492.606 | 495.408 | 492.977 | 0.086 | 1646 | 1.160 |
| Greece | 457.414 | 451.370 | 451.633 | 0.105 | 1662 | 1.253 |
| Hungary | 475.987 | 481.083 | 480.912 | 0.094 | 1586 | 0.640 |
| Ireland | 518.078 | 499.633 | 496.114 | 0.078 | 1730 | 1.159 |
| Italy | 476.285 | 486.590 | 468.012 | 0.107 | 1742 | 0.957 |
| Latvia | 478.699 | 496.126 | 487.251 | 0.091 | 1556 | 1.281 |
| Lithuania | 475.873 | 481.191 | 482.067 | 0.095 | 1510 | 0.718 |
| Luxembourg | 469.985 | 483.421 | 476.769 | 0.107 | 1646 | 1.083 |
| Netherlands | 484.784 | 519.231 | 503.384 | 0.057 | 1632 | 1.156 |
| Poland | 511.856 | 515.648 | 511.036 | 0.124 | 1697 | 1.455 |
| Portugal | 491.801 | 492.487 | 491.677 | 0.096 | 1759 | 1.399 |
| Slovakia | 457.984 | 486.165 | 464.048 | 0.078 | 1517 | 0.907 |
| Slovenia | 495.346 | 508.898 | 507.007 | 0.113 | 1686 | 1.428 |
| Sweden | 505.785 | 502.388 | 499.445 | 0.084 | 1631 | 1.925 |
Source: PISA 2018 Database, OECD, 2018, Retrieved June 4, 2023, from https://pisadataexplorer.oecd.org/ide/idepisa/dataset.aspx; UNESCO Institute for Statistics 2018 Database, UNESCO, 2018, Retrieved June 4, 2023, from http://data.uis.unesco.org
Table 2
Best-to-Others and Others-to-Worst pairwise comparison vectors
| Criteria | Best-to-Others (BO) | Others-to-Worst (OW) |
| reading score | 2 | 6 |
| maths score | 1 | 7 |
| science score | 4 | 4 |
| teachers/students ratio | 5 | 3 |
| learning time | 7 | 1 |
| government expenditure on primary education as a percentage of GDP | 3 | 5 |
Source: authors’ own work.
Table 3
Weights of criteria resulting from BWM
| Criteria | Weights |
| maths score | 0.379022 |
| reading score | 0.224769 |
| government expenditure on primary education as a percentage of GDP | 0.149846 |
| science score | 0.112384 |
| teachers/students ratio | 0.089907 |
| learning time | 0.044072 |
Source: authors’ own work.
The EDAS method with BWM criteria weights is implemented to perform the educational performance evaluation of twenty EU member states using the data provided in Table 1. Table 4 displays the normalised weighted sum of the positive distance from the average solution (NSPi), the normalised weighted sum of the negative distance from the average solution (NSNi), the appraisal score (ASi), and the position of each country in the overall ranking.
Table 4
Results obtained using the proposed integrated approach
| EU countries | NSPi | NSNi | ASi | Rank |
| Sweden | 1 | 0.916603 | 0.958301 | 1 |
| Poland | 0.904338 | 1 | 0.952169 | 2 |
| Belgium | 0.652338 | 1 | 0.826169 | 3 |
| Slovenia | 0.632778 | 1 | 0.816389 | 4 |
| Estonia | 0.748533 | 0.864843 | 0.806688 | 5 |
| Denmark | 0.663988 | 0.807466 | 0.735727 | 6 |
| Finland | 0.448235 | 0.955839 | 0.702037 | 7 |
| Portugal | 0.312764 | 0.959537 | 0.636151 | 8 |
| Latvia | 0.084986 | 0.892262 | 0.488624 | 9 |
| Ireland | 0.179638 | 0.785775 | 0.482706 | 10 |
| France | 0.016706 | 0.856482 | 0.436594 | 11 |
| Netherlands | 0.191250 | 0.538460 | 0.364855 | 12 |
| Luxembourg | 0.146486 | 0.578550 | 0.362518 | 13 |
| Italy | 0.178218 | 0.447999 | 0.313108 | 14 |
| Austria | 0.038674 | 0.541853 | 0.290264 | 15 |
| Greece | 0.185217 | 0.364732 | 0.274974 | 16 |
| Czechia | 0.026922 | 0.325712 | 0.176317 | 17 |
| Lithuania | 0.032159 | 0.084428 | 0.058293 | 18 |
| Slovakia | 0 | 0.095293 | 0.047646 | 19 |
| Hungary | 0.020053 | 0 | 0.010026 | 20 |
Source: authors’ own work.
As shown in Table 4, the best-performing country regarding educational performance was determined as Sweden, succeeded by Poland, Belgium, Slovenia and Estonia. Furthermore, it is worth noting that the complete ranking order of the countries is achieved using the proposed approach.
Discussion
In order to examine the robustness of the proposed framework, other well-known distance-based MCDM methods, namely TOPSIS, VIKOR and CODAS (COmbinative Distance-based ASsessment) are implemented to assess the education performance of nations using the dataset provided in Table 1, and are based on finding a compromise solution for the decision-making problem. The basic principle for the compromise solution, which can be defined as a feasible solution closest to the ideal, was introduced by Yu (1973) and Zeleny (1982). TOPSIS and VIKOR are based on aggregate functions representing "closeness to ideal", while CODAS evaluates the alternatives using the distance to the anti-ideal solution, and the EDAS method used in this study focuses on calculating positive and negative distances from the average solution. The EDAS method therefore enables a more practical analysis, as it does not demand determining the ideal and/or anti-ideal solutions as reference points.
The fundamental notion of the TOPSIS method is that the selected alternative ought to have the "shortest distance" to the ideal solution and the "farthest distance" to the anti-ideal solution (Hwang & Yoon, 1981). The TOPSIS method sets forth two "reference points", although not considering the relative importance of distances from these points.
The VIKOR method introduces a ranking metric based on the degree of closeness to the ideal solution (Opricovic, 1998), which aggregates all criteria, their relative importance, and the balance between overall and individual satisfaction (Opricovic & Tzeng, 2004). In this ranking metric, v signifies the weight of the strategy of "the majority of criteria", and v is assumed to be 0.5 as in numerous other studies.
In the CODAS method, the alternatives are evaluated according to the distance to the anti-ideal solution, which is defined as the combination of the Euclidean distance and the Taxicab distance (Keshavarz-Ghorabaee et al., 2016), and the best alternative is identified as the one having the farthest distance to the anti-ideal solution. The same set of criteria weights obtained from BWM is used for the implementation of other distance-based MCDM methods. The ranking results obtained from TOPSIS, VIKOR and CODAS with the BWM weights are presented in Table 5, while Figure 1 displays a comparative analysis of the results by showing the rankings of countries according to the considered distance-based MCDM methods.
Table 5
Results obtained using the proposed integrated approach
| EU countries | TOPSIS | VIKOR | CODAS |
| Austria | 16 | 10 | 16 |
| Belgium | 2 | 7 | 4 |
| Czechia | 17 | 13 | 17 |
| Denmark | 4 | 4 | 6 |
| Estonia | 6 | 1 | 3 |
| Finland | 8 | 3 | 7 |
| France | 12 | 12 | 12 |
| Greece | 10 | 20 | 14 |
| Hungary | 20 | 18 | 19 |
| Ireland | 11 | 8 | 10 |
| Italy | 15 | 15 | 15 |
| Latvia | 9 | 14 | 9 |
| Lithuania | 19 | 17 | 18 |
| Luxembourg | 14 | 16 | 13 |
| Netherlands | 13 | 9 | 11 |
| Poland | 3 | 2 | 2 |
| Portugal | 7 | 11 | 8 |
| Slovakia | 18 | 19 | 20 |
| Slovenia | 5 | 5 | 5 |
| Sweden | 1 | 6 | 1 |
Source: authors’ own work.
Figure 1
Comparative analysis of the rankings of countries

Source: authors’ own work.
The Spearman rank correlation coefficients between the rankings of these distance-based MCDM methods are calculated and presented in Table 6.
Table 6
Spearman rank correlation matrix for the rankings obtained from distance-based MCDM methods
| EDAS | TOPSIS | VIKOR | CODAS | |
| EDAS | 1 | 0.9594 | 0.8511 | 0.9880 |
| TOPSIS | 1 | 0.7504 | 0.9639 | |
| VIKOR | 1 | 0.8496 | ||
| CODAS | 1 |
Source: authors’ own work.
The Spearman rank correlations indicate that the similarities between the rankings obtained from these approaches are statistically significant (Ramsey, 1989). The ranking results illustrate that Sweden stands out as the best-performing country using EDAS, TOPSIS and CODAS, while Poland is ranked second in terms of education performance using EDAS, VIKOR and CODAS.
Summary and concluding remarks
This research proposes an integrated decision framework using the EDAS method with weights obtained from BWM to assess the educational performance of EU nations. The EDAS method depends on the computation of the positive distance and the negative distance from the average solution, where greater values of the positive distance from the average solution and/or smaller values of the negative distance from the average solution indicate that the alternative solution is superior to the average solution. While other well-known distance-based MCDM methods compare the alternatives with regard to ideal and anti-ideal solutions, the EDAS method does not require identifying ideal and/or anti-ideal solutions as reference points, and thus provides a more practical analysis.
BWM is a min-max mathematical programming model that sets the preference of the best criterion over all other criteria, as well as the preference of all criteria over the worst criterion. Taking into account the benefits of BWM, namely demanding fewer pairwise comparisons and producing relatively more consistent outcomes, the linear form of BWM is used to compute the weights of criteria, which are subsequently incorporated into EDAS.
A case study assessing the educational performance is conducted by analysing 20 EU countries considering six attributes denoted as reading, mathematics and science PISA test scores, the ratio of teachers to students, the learning time of students, and government expenditure on primary education as a percentage of GDP. In MCDM terminology, an attribute or performance criterion should provide a means of evaluating the levels of an objective (Hwang & Yoon, 1981). This study does therefore not categorise the considered attributes as policy and outcome, but, in accordance with MCDM terminology, these factors are used as a means to assess the educational performance of countries through a robust decision-making framework. According to expert judgements for determining the BWM weights, the mathematics score is revealed as the most important attribute, whilst learning time is revealed as the least important.
Using the proposed integrated BWM&EDAS approach, Sweden is identified as the country with the highest education performance followed by Poland, Belgium, Slovenia and Estonia. The TOPSIS, VIKOR and CODAS methods are applied to the same dataset using the BWM weights. The results illustrate that similarities between the rankings obtained from the proposed approach and other widely used distance-based MCDM methods are statistically significant, and thus the proposed integrated decision approach can be considered as a reference decision aid in education policy assessment.
It is worth noting that the outcomes of the analyses may differ if other criteria based on alternative data sources are taken into consideration. Future research could focus on extending this study by considering attributes possessing qualitative data to incorporate imprecision into the education performance assessment. Moreover, EDAS can be combined with other weighting approaches as future research work.
Notes This manuscript is an extended version of the authors’ paper presented at the International Academic Conference on Management, Economics and Marketing in Vienna, Austria on 7 July 7 2023, for which "e-mentor" was a supporting journal.
References
- Amavilah, V. H., & Rodríguez Andrés, A. (2022). Knowledge economy and the economic performance of African Countries: A seemingly unrelated and recursive approach. Journal of the Knowledge Economy, 15, 110-143. https://doi.org/10.1007/s13132-022-01033-7
- Aparicio, J., Cordero, J. M., Gonzalez, M., & Lopez-Espin, J. J. (2018). Using non-radial DEA to assess school efficiency in a cross-country perspective: An empirical analysis of OECD countries. Omega, 79, 9–20. https://doi.org/10.1016/j.omega.2017.07.004
- Aparicio, J., Perelman, S., & Santín, D. (2022). Comparing the evolution of productivity and performance gaps in education systems through DEA: an application to Latin American countries. Operational Research, 22, 1443-1477. https://doi.org/10.1007/s12351-020-00578-2
- Gebre, S. L., Cattrysse, D., & Van Orshoven, J. (2021). Multi-criteria decision-making methods to address water allocation problems: A systematic review. Water, 13(2), 125. https://doi.org/10.3390/w13020125
- Ginevicius, R. (2011). A new determining method for the criteria weights in multicriteria evaluation. International Journal of Information Technology & Decision Making, 10(6), 1067–1095. https://doi.org/10.1142/S0219622011004713
- Gupta, S., Verhoeven, M., & Tiongson, E. R. (2002). The effectiveness of government spending on education and health care in developing and transition economies. European Journal of Political Economy, 18(4), 717-737. https://doi.org/10.1016/S0176-2680(02)00116-7
- Hanushek, E. A., & Woessmann, L. (2020). A quantitative look at the economic impact of the European Union’s educational goals. Education Economics, 28(3), 225-244. https://doi.org/10.1080/09645292.2020.1719980
- Hwang, C. L., & Lin, M. J. (1987). Group decision making under multiple criteria: Methods and applications. Springer-Verlag.
- Hwang, C. L., & Yoon, K. (1981). Multiple attribute decision making. Methods and applications: a state-of-the-art survey. Springer-Verlag.
- Ishizaka, A., & Resce, G. (2021). Best-Worst PROMETHEE method for evaluating school performance in the OECD’s PISA project. Socio-Economic Planning Sciences, 73, 100799. https://doi.org/10.1016/j.seps.2020.100799
- Keshavarz-Ghorabaee, M., Zavadskas, E. K., Olfat, L., & Turskis, Z. (2015). Multi-criteria inventory classification using a new method of Evaluation Based on Distance from Average Solution (EDAS). Informatica, 26(3), 435–451. https://doi.org/10.15388/Informatica.2015.57
- Keshavarz-Ghorabaee, M., Zavadskas, E. K., Turskis, Z., & Antucheviciene, J. (2016). A new combinative distance-based assessment (CODAS) method for multi-criteria decision-making. Economic Computation & Economic Cybernetics Studies & Research, 50(3), 25-44.
- Keršuliene, V., Zavadskas, E. K., & Turskis, Z. (2010). Selection of rational dispute resolution method by applying new step‐wise weight assessment ratio analysis (SWARA). Journal of Business Economics and Management, 11(2), 243–258. https://doi.org/10.3846/jbem.2010.12
- Kocak, D., Ture, H., & Atan, M. (2019). Efficiency measurement with network DEA: an application to sustainable development goals 4. International Journal of Assessment Tools in Education, 6(3), 415-435. https://doi.org/10.21449/ijate.539487
- Lewis, S., & Lingard, B. (2022). Platforms, profits and PISA for schools: new actors, by-passes and topological spaces in global educational governance. Comparative Education, 59(1), 99-117. https://doi.org/10.1080/03050068.2022.2145006
- OECD. (2018). PISA 2018 Database. Retrieved June 4, 2023, from https://pisadataexplorer.oecd.org/ide/idepisa/dataset.aspx
- OECD. (2019). PISA 2018 Results (Volume I): What students know and can do. OECD Publishing. https://doi.org/10.1787/5f07c754-en
- Opricovic, S. (1998). Multicriteria optimization of civil engineering systems. Faculty of Civil Engineering, 2(1), 5-21.
- Opricovic, S., & Tzeng, G. H. (2004). Compromise solution by MCDM methods: A comparative analysis of VIKOR and TOPSIS. European Journal of Operational Research, 156(2), 445–455. https://doi.org/10.1016/S0377-2217(03)00020-1
- Pekelman, D., & Sen, S. K. (1974). Mathematical Programming Models for the Determination of Attribute Weights. Management Science, 20(8), 1217–1229. https://www.jstor.org/stable/2629998
- Psacharopoulos, G. (1994). Returns to investment in education: A global update. World Development, 22(9), 1325–1343. https://doi.org/10.1016/0305-750X(94)90007-8
- Ramsey, P. (1989). Critical Values for Spearman’s Rank Order Correlation. Journal of Educational Statistics, 14(3), 245–253. https://doi.org/10.3102/10769986014003245
- Rezaei, J. (2015). Best-worst multi-criteria decision-making method. Omega, 53, 49–57. https://doi.org/10.1016/j.omega.2014.11.009
- Rezaei, J. (2016). Best-worst multi-criteria decision-making method: Some properties and a linear model. Omega, 64, 126–130. https://doi.org/10.1016/j.omega.2015.12.001
- Saaty, T. L. (1977). A scaling method for priorities in hierarchical structures. Journal of Mathematical Psychology, 15(3), 234–281. https://doi.org/10.1016/0022-2496(77)90033-5
- Saaty, T. L. (2004). Decision making – the Analytic Hierarchy and Network Processes (AHP/ANP). Journal of Systems Science and Systems Engineering, 13(1), 1–35. https://doi.org/10.1007/s11518-006-0151-5
- Shannon, C. E. (1948). A mathematical theory of communication. Bell System Technical Journal, 27(3), 379–423. https://doi.org/10.1002/j.1538-7305.1948.tb01338.x
- Srinivasan, V., & Shocker, A. D. (1973). Linear programming techniques for multidimensional analysis of preferences. Pyschometrika, 38(3), 337-369. https://doi.org/10.1007/BF02291658
- Stamenković, M., Anić, I., Petrović, M., & Bojković, N. (2016). An ELECTRE approach for evaluating secondary education profiles: evidence from PISA survey in Serbia. Annals of Operations Research, 245(1–2), 337–358. https://doi.org/10.1007/s10479-015-1823-7
- Ucar, E., & Karsak, E. E. (2021). Educational Performance Assessment of OECD Countries Using PISA 2018 Data. Proceedings of IAC 2021 in Vienna (pp. 64-73). https://www.conferences-scientific.cz/file/9788088203223
- UNESCO. (2018). UNESCO Institute for Statistics 2018 Database. Retrieved June 4, 2023, from http://data.uis.unesco.org
- Yu, P. L. (1973). A class of solutions for group decision problems. Management Science 19(8), 936–946. https://doi.org/10.1287/mnsc.19.8.936
- Zeleny, M. (1982). Multiple criteria decision making. Mc-Graw-Hill.

 https://orcid.org/0000-0002-3921-6189