About the article
DOI: https://www.doi.org/10.15219/em110.1713
The article is in the printed version on pages 51-62.
 Download the article in PDF version
How to cite
Frelek, E. U., & Czarnacka-Chrobot, B. (2025). Leveraging open-source big data tools to enhance the attractiveness of public transport: A proposed application. e-mentor, 3(110), 51-62. https://www.doi.org/10.15219/em110.1713
E-mentor number 3 (110) / 2025
Table of contents
- Introduction
- Literature Review
- Data Used in the Application Project
- Selecting Architectures for the Application
- Selection of Microservices and Containerisation Tool
- Data Flows between Services
- Visualisation of Key Application Functionalities
- Functionalities Intended for Public Transport Passengers
- Functionalities Supporting Public Transport Planning
- Summary
- References
About the author
Leveraging Open-Source Big Data Tools to Enhance the Attractiveness of Public Transport: A Proposed Application
Emilia U. Frelek, Beata Czarnacka-Chrobot
Abstract
Public transport is a factor that significantly impacts urban quality of life—commuting time, noise, and exhaust emissions. In Poland, a decline in the use of public-transport in favour of private transport had been observed for many years. Despite a rebound after 2020, it never returned to previous levels, while the motorisation rate continues to rise, resulting in lower average traffic speeds, extensive urban congestion, as well as noise and harmful exhaust emissions. To reverse this trend, the attractiveness of public transport relative to private transport would need to be improved, including more efficient planning. The aim of this article is to present selected opportunities for using open-source Big Data tools to enhance the appeal of public transport, with a case study—the authors’ proposed application—presented using data from the ‘Open Data - The Warsaw Way’ project conducted by the City of Warsaw. The proposed application, built on microservice-based architecture, enables, inter alia, spatial-data visualisation through maps, analysis of aggregate data, and ad-hoc querying, delivering functionality facilitating passengers’ use of urban public transport and supporting public-transport planning, thereby demonstrating that open-source Big Data tools can be successfully employed to underpin actions and decisions aimed at increasing the attractiveness of public transport.
Keywords: public-transport attractiveness, open-source Big Data tools, ‘Open Data - The Warsaw Way’ project, Big Data architectures, microservice-based application, spatial-data visualisation
Introduction
Urban public transport is a factor that significantly impacts urban quality of life. Efficient public transport reduces passengers’ travel time to workplaces and educational institutions, and curbs noise and exhaust emissions by decreasing private-car traffic. In Poland—until the pandemic year 2020—a systematic decline in public-transport use had been observed for many years (Jakubowski & Dulak, 2018; Walków, 2020). Since 2020, a marked rebound and year-on-year increase has occurred (GUS, 2025), although the rising motorisation rate and individualisation of mobility, as reported by Statistics Poland, pose an ever-greater challenge: over the past two decades the number of passenger cars in Poland has doubled (Ciekawestatystyki.pl, 2025). The growing strain on transport infrastructure caused by private-car traffic lowers average speeds and generates widespread urban congestion (Krajewska & Łukasik, 2017, p. 203), diminishing the quality of urban life—travelling around the city takes an increasing amount of time, with residents exposed to harmful environmental pollution. Reversing this unfavourable trend requires decisive, continuous action aimed at enhancing the attractiveness of public transport relative to private transport.
The need to introduce urban preferences for public transport was recognised long ago in both Polish cities and at the national level. In 2005, appropriate incentives were enacted in the ‘National Transport Policy for 2006–2025’, and again in the ‘Strategy for Responsible Development’ (Uchwała Nr 8 Rady Ministrów…., 2017), according to which ‘actions should be directed at increasing the efficiency and attractiveness of public transport, thereby encouraging residents to shift from individual to collective modes’ (Gadziński & Goras, 2019, p. 9).
The attractiveness of public transport can be increased by the appropriate location of stops, placing them close to popular destinations and accessible to all users. Enhancing the competitiveness of public transport can also be achieved by granting it priority in urban movement (e.g. designating bus lanes, restricting private-vehicle access in city centres, implementing public-transport-actuated traffic signals) (Kopeć, 2016, p. 667). Measures to raise the attractiveness of public transport should lead to increased usage thereof, and a simultaneous decrease in private-car use; in the long term, they should alter residents’ travel habits.
Enhancing the attractiveness of public transport in large metropolitan areas constitutes a major logistical challenge, with optimal decision-making demanding thorough analysis, which can be performed with the aid of advanced computational tools. The aim of this article is to present selected opportunities for employing open-source Big Data tools to analyse public-transport data, supporting decisions and actions that increase its appeal relative to private transport. For the development of the application, data held by the City of Warsaw will be used, and the design process and implementation outcomes of the solution are described together with exemplary decisions and actions that can be taken on the basis of the information provided. In addition to functions that assist public-transport managers in transport planning, passenger-oriented features that facilitate the use of urban public transport are also presented. The proposed application project is a case study on the possibilities of enhancing the attractiveness of public transport in Warsaw; however, an analogous application could be designed for any other city that makes appropriate data available.
The first section of the article provides a concise review of the most recent literature, the second section discusses the data analysed within the project, the third section is devoted to criteria guiding the selection of architectures for the proposed application and to a concise description of the chosen architectures, and the fourth section presents micro-services selected in the project and the containerisation tools employed. The fifth section outlines the data flows between services, while the sixth focuses on the presentation of the application’s key functionalities through example views (visualisations), as well as on sample conclusions and decisions that can be made to enhance the attractiveness of urban public transport in Warsaw based on data analysis. The final section summarises the authors’ proposal.
Literature Review
Open-source Big Data tools have already been used in the literature to support urban-transport planning, with representative recent contributions including the study presented in (Prommaharaj et al., 2020), which describes the development of the open-source tool PubtraVis, which dynamically visualises GTFS (General Transit Feed Specification) data and analyses operational parameters (speed, traffic density, waiting time). Designed for cities and transport operators, its usefulness in optimising routes and identifying bottlenecks is demonstrated on data from Calgary, Canada. In the work of (Goliszek, 2021) in turn, GTFS data is combined with Python, QGIS and OSMnx to model bus and tram accessibility in Szczecin. The author presents a door-to-door method, comparing public and private transport travel times, highlighting the value of open GTFS data as a basis for transparent and scalable modelling. In Andrei and Luca (2021) the authors use open-source components (QGIS, PostGIS, OpenStreetMap and GTFS) to analyse the efficiency of Bucharest’s tram network. They model infrastructure, timetables and stops, integrating spatial and temporal data to assess service coverage, demonstrating that open-source approaches enable transparent, scalable analysis of urban transport. The publication Lopes et al. (2023) presents four simplified GTFS-based models for the Västra Götaland region, created in Python, which support different stages of urban planning—from detailed to strategic. Worth mentioning is also (Alamri et al., 2023), in which the authors develop a PostGIS and QGIS framework for analysing transport accessibility in large metropolitan areas, integrating GTFS, administrative boundaries and the OSM (OpenStreetMap) network. The framework allows analysis of the level of urban public transport relative to different population groups, enabling recommendations for network development and service coverage. In Naro et al. (2024), the City Transport Analyzer plugin for QGIS is introduced; it processes GTFS data to analyse public-transport accessibility and modal-shift potential. The plugin uses open-source libraries (NetworkX) to produce isochrones and multi-modal itineraries. Testing on data from Milan and Rio de Janeiro confirmed its utility for planners and decision-makers. All the tools described employ publicly available GTFS data and open-source software (Python, QGIS, PostGIS). Among the literature concerning Warsaw, one should note a study in which the authors developed a machine-learning (ML) model to analyse bus delays in Warsaw using publicly available geolocation data, showing that ML models can effectively predict the behaviour of the urban fleet, enabling improved planning and route optimisation (Pałys et al., 2022). The paper Luckner et al. (2017) is a Warsaw-based example in which the current state of public-transport stops was analysed by collecting and examining Twitter posts and official municipal sources. Text mining and GIS (open data) were employed. In Niedzielski et al. (2024), the impact of tram-priority traffic signals in Warsaw on travel time to workplaces between 2015 and 2022 was analysed. Using open TDM (Topological Data Model) data, the authors showed that tram priority reduced travel times by 6.7% and increased employment accessibility by 5–8.5%. This demonstrates the effectiveness of infrastructure interventions supported by Big Data analysis.
From the above concise literature review, a research gap emerges that can be formulated as follows: despite a growing body of global research using open-source Big Data tools to enhance the attractiveness of public transport, including its planning, there is a shortage of such studies based on openly available data for cities in Central and Eastern Europe, including Warsaw. This gap justifies the need for research demonstrating how open-source solutions can support both passengers and urban decision-makers. The application proposed in this article addresses this research gap.
Data Used in the Application Project
The data used to implement the application project originate from the ‘Open Data - The Warsaw Way’ project, which has been running since 2015 and whose objective is “to improve the lives of the capital’s residents by the City of Warsaw by sharing information that may be useful to citizens in a uniform and orderly manner” (Miasto Stołeczne Warszawa, 2015). As part of the project, the City of Warsaw pursues the principles of transparency and information society and supports entrepreneurship and innovative use of information. Access to the data provided under the project is free, and as official public-sector information it is not protected by copyright; however, any use of this public data must include an attribution to the source and the date of use (http://api.um.warszawa.pl).
The City of Warsaw provides a wide range of data, the analysis of which can certainly lead to valuable insights. Portal data is updated whenever changes occur, or every minute in the case of continuously changing data. The available data concerns, among others, culture, education, safety, real estate, administration, urban greenery, waste segregation and transport—including ZTM (Public Transport Authority) timetables, public-transport stop locations, bus and tram locations, bicycle routes, car parks, and information on construction works on traffic routes.
This article focuses on leveraging the potential of open-access Big Data tools to enhance the attractiveness of urban public transport, including its efficient planning; therefore, among the available data, that relating to urban public transport is used. Data retrieved via the API (Application Programming Interface) includes: (1) stop locations, (2) ZTM timetables and (3) bus and tram locations.
Figure 1Data format returned by the ‘Open Data – The Warsaw Way’ API
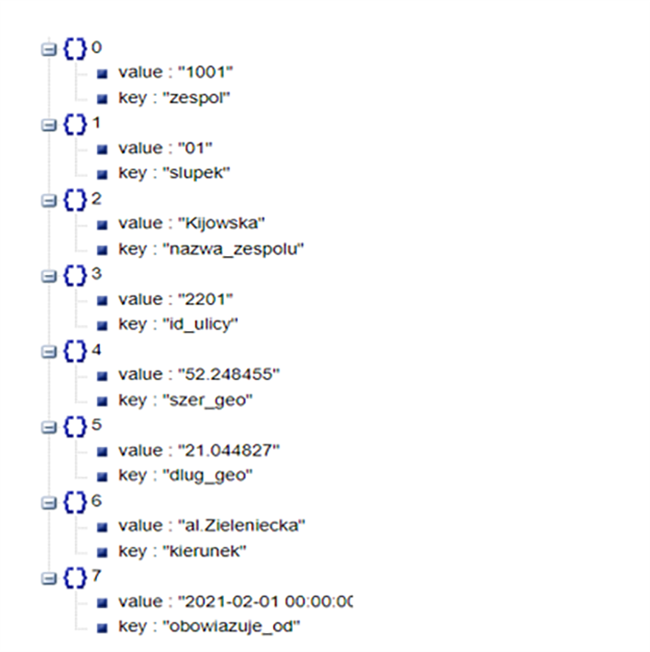
Source: authors' own work based on “Otwarte dane - czyli dane po warszawsku” [Open Data - The Warsaw Way], 2015, Miasto Stołeczne Warszawa [City of Warsaw] (http://api.um.warszawa.pl).
Data returned by the API is in JSON (JavaScript Object Notation) format. Figure 1 shows a sample record describing a public-transport stop retrieved from the ‘Open Data - The Warsaw Way’ API. The data is structured as a dictionary, with individual attributes expressed as key–value pairs.
Bus and tram locations are updated every minute; therefore, to yield meaningful insights, the data was collected for more than one week (18–27 April 2021) in order to capture vehicle movements both at weekends and on all working days outside holiday or vacation periods. Over seven gigabytes of data was gathered and analysed in subsequent project phases. This data satisfies the definition of Big Data in the form of the so-called ‘5 V’s’ (Mucci & Stryker, 2024): volume, velocity of real-time growth, variety of structure and content, veracity, and value for decision-making processes.
Selecting Architectures for the Application
Big Data architectures are designed to handle datasets that are too large or complex for traditional database systems, defining how data is collected, stored, analysed and visualised, and can also specify data transformations required for analysis and reporting. Such architectures are tailored to fulfil at least one of the following tasks: (1) interactive exploration of datasets, (2) real-time data processing, (3) batch-mode data processing, (4) prediction and analysis using machine learning (Tejada, 2025).
The most commonly employed Big Data architectures include: the Lambda architecture (Behera & Kalipe, 2019, pp. 2183–2184; Tejada, 2025), the Kappa architecture (Tejada, 2025), the Zeta architecture (Behera & Kalipe, 2019, p. 2186; Konieczny, 2017; Scott, 2015), the Internet of Things (IoT) architecture (Kim et al., 2017; Nag et al., 2019; Tejada, 2025) and microservice-based architecture (Behera & Kalipe, 2019, p. 2185; Martin, 2019; Nowak, 2020). These architectures were evaluated against the project’s hardware requirements (see Table 1) – with the exception of the IoT architecture. Although the project data originates from IoT devices, it is not retrieved directly from them but indirectly via the API provided by the City of Warsaw; therefore, the IoT architecture is unsuitable for the proposed application, as it presupposes direct interaction with IoT devices. The remaining architectures meet the project’s requirements, although analysis of the required RAM (Random Access Memory), CPU (Central Processing Unit) cores, disk space and network-card specifications revealed that implementing Lambda, Kappa or Zeta architectures would be prohibitively expensive. They were consequently rejected, and by elimination, microservice-based architecture was selected for the application.
A microservice-based architecture employs a collection of loosely coupled autonomous services, with each service performing a specific function and operating independently, allowing development and deployment without affecting other functions. Services communicate via application programming interfaces, while the internal operation of each service remains opaque to the others. The chosen architecture offers several advantages, and owing to the independence of the individual services, they may be implemented with different technologies and libraries best suited to their functions. Services can be scaled independently without scaling the entire system. The decomposition into small services enables a single team to design, test and deploy a service, facilitating management and improving team efficiency. Moreover, it simplifies system documentation and the rollout of new service versions (Martin, 2019).
However, such architecture also presents significant challenges. Developing a microservice-based system is complex and requires a secure inter-service communication mechanism. Network congestion and latency can disrupt service communication, while the use of diverse technologies complicates maintenance, and cross-technology service interaction may necessitate additional data transformation. Services are typically run in separate containers, further increasing resource consumption (Behera & Kalipe, 2019, p. 2185). Consequently, a containerisation tool is also required.
Containers are independent, isolated runtime instances that operate within the kernel of a single operating system. Despite isolation, communication channels can be defined between containers, enabling data exchange among services running in different containers. Each container has its own file system, environment variables, allocated RAM and IP address (Nowak, 2020).
Table 1Comparison of Hardware Requirements for Big Data Architectures
| Architecture | Technologies and Tools | Hardware Requirements |
| Lambda | - Batch processing layer: distributed file system HDFS with MapReduce, Pig, Hive - Real-time processing layer: Apache Storm - Supporting layer: NoSQL database, e.g. Hbase - Queuing system: Apache Kafka |
- Batch processing layer and real-time processing layer: 12 GB RAM, 22 CPU cores, 2 TB disk space, 1GbE network card - Supporting layer: 16 GB RAM, 4 CPU cores, 1 TB disk space |
| Kappa | - Data ingestion: Apache Kafka - Real-time processing layer: Apache Storm - Supporting layer: NoSQL database Cassandra |
- Data ingestion: 10 servers, each with 16 GB RAM and 12 CPU cores - Real-time processing layer: 16 GB RAM, 6 CPU cores, 8 TB disk space, 1GbE network card - Supporting layer: 16 GB RAM, 4 CPU cores, 1 TB disk space |
| Zeta | - Distributed file system: HDFS - Real-time data store: NoSQL database, e.g. HBase - Execution engine: MapReduce, Spark, Apache Drill - Global resource manager: YARN - Container deployment and management: Docker, Kubernetes |
- Distributed file system and global resource manager: 12 GB RAM, 22 CPU cores, 2 TB disk space, 1GbE network card - Real-time data store: 16 GB RAM, 4 CPU cores, 1 TB disk space - Execution engine: MapReduce, Spark, Apache Drill - Container deployment and management: 16 GB RAM, 6 CPU cores, approx. 300 GB disk space |
| Microservice-based architectures | - Container deployment and management: Docker, Kubernetes - Version control system: Git - Continuous Integration (CI): Jenkins |
- Container deployment and management: 16 GB RAM, 6 CPU cores, approx. 300 GB disk space - Continuous Integration: 1 GB RAM, min. 50 GB disk space |
Source: authors' own work based on “Big Data Architectures: a detailed and application-oriented review”, R. K. Behera & G. K. Kalipe, 2019, International Journal of Innovative Technology and Exploring Engineering, 8(9), pp. 2182–2190 (https://doi.org/10.35940/ijitee.H7179.078919).
Containerisation is a solution that eliminates most of the disadvantages of traditional virtualisation, removing the layers of the virtual operating system and hypervisor, thereby reducing the number of abstraction layers to four. As a result, the performance gap between applications running directly on physical hardware and those running in containers is minimal, while scalability, portability and instance isolation are preserved (Nowak, 2020).
In addition to a containerisation tool, due to the underlying assumption of inter-team collaboration, a microservice-based architecture also requires a version control tool.
Selection of Microservices and Containerisation Tool
The first step in developing the application was to design its structure through the selection of appropriate microservices. An analysis of the functions and processes necessary for the application’s operation was conducted for this purpose, with the required functions being: (1) acquiring online data from the ‘Open Data - The Warsaw Way’ API, (2) queuing and buffering data, (3) stream data processing, (4) data storage, and (5) real-time data analysis and visualisation. According to the assumptions of the microservice-based architectures, individual services should be run in containers; hence, the selection of an appropriate containerisation and container-management tool is also required.
Data acquisition from the ‘Open Data - The Warsaw Way’ API and transmission to the service responsible for queuing incoming data was performed by programmes written in Python (Bartoszuk et al., 2016). From the broad collection of available Python libraries, the following were used: (1) requests – dedicated to creating and handling HTTP messages, used in the described project for API communication; (2) json – for converting data to and from the JSON format, used to read data received from the ‘Open Data - The Warsaw Way’ API; (3) Kafka – providing a client for Apache Kafka, compatible with all Kafka brokers, used to send data obtained from the API to the Apache Kafka service. Python was chosen for its code readability, general-purpose nature, and interpretability.
For data queuing, the Apache Kafka queuing system was used, being responsible for receiving, producing and distributing messages between services, providing a flexible means of communication among the various components of the architecture. Message producers send messages to the service, while message consumers can receive them from the stream published by the service. The producer and consumer are linked only by a single message group, called a topic, with the consumer receiving all messages from a given topic via Kafka, coming from multiple producers, while messages sent by producers to a particular topic will be delivered to every consumer listening to that topic (Dzikowski, 2014). The advantage of the described queuing system is its open-source licence, allowing free use of the service. At the same time, Apache Kafka ensures a high level of reliability, performance enabling the handling of millions of messages per second, as well as the capability to operate in a distributed environment.
Kafka is a distributed service, so running it additionally requires a service for the coordination of distributed applications. For this purpose, Apache Kafka utilises Zookeeper, which operates as a centralised service managing node names, configuration data, and synchronisation between distributed systems. Zookeeper is responsible for managing all brokers and the configuration of all topics: the list of existing topics, the number of partitions for each topic, and the location of replicas (Vinka, 2018).
Kafka Streams will be used for stream processing, as it is a flexible, scalable and fault-tolerant service that guarantees processing latency at the millisecond level. Kafka Streams processes each message exactly once, without losing any input messages or generating duplicate output messages. The service does not buffer input messages, processing streams one record at a time, yet it can handle stateless, stateful and windowed operations on data (Kafka, n.d.).
Data storage, processing, as well as analysis and visualisation, can be accomplished using the product suite known as Elastic Stack, which includes three core services: Elasticsearch, Logstash and Kibana (Elastic, n.d.).
Elasticsearch is a full-text search engine and a database built on Apache Lucene, with data stored as collections of documents called indices. Elasticsearch enables advanced grouping and filtering of results, indexing of incoming data, and storage in various formats. The service is well-suited for searching within very large datasets, allowing for the registration of highly detailed data. An Elasticsearch cluster may consist of multiple nodes, i.e. individual servers. On these servers, data are stored in collections called indices, which correspond to databases. A type is a method of grouping documents, corresponding to the concept of a table in relational databases. A document is equivalent to a record in a relational database. Elasticsearch stores documents in JSON format (Lewandowski, 2021).
The next tool in the Elastic Stack suite is Logstash, the primary function of which is to collect information from many different sources, quickly transform it, and send the data to its destination, for example, to the Elasticsearch service (Anil, 2023).
Kibana is a service closely integrated with Elasticsearch, enabling the search, browsing and visualisation of data indexed in Elasticsearch, providing numerous data visualisation options, such as bar charts, pie charts, tables, histograms and maps. The map visualisation feature is particularly important for the designed application, as it enables the display of public transport vehicle locations and other infrastructure elements. Kibana also allows the creation of analytical views containing the previously mentioned visual elements (Elastic, n.d.).
A significant advantage of Elastic Stack products is their open-source licence, which allows legal, free use and modification of the software. Elastic Stack is a low-cost, scalable solution that can be easily migrated to the cloud. Another key factor behind the choice of Elastic Stack was its popularity. With Elastic Stack products, two of the five defined functionalities will be implemented: data storage, and real-time data analysis and visualisation. The remaining functionalities will be delivered using services outside this product suite.
An important element of the microservice-based architectures is the use of containers to run individual services. To implement containerisation in the project, it is necessary to employ a tool for creating and managing containers. Currently, the most commonly used containerisation tool is Docker. Its advantages include an open-source licence and widespread adoption. Docker allows applications to be placed in lightweight, virtual containers along with their dependencies, such as libraries, configuration files, and databases. A significant argument in favour of Docker as the containerisation tool is the availability of ready-made container images for various services in Docker’s official repository (Mindbox, 2021).
Data Flows between Services
The diagramme illustrating the operation of the application for analysing public transport data in Warsaw, as well as the data flows between services, is presented in Figure 2. The Kafka Streams, Kafka, Zookeeper, Logstash, Elasticsearch, and Kibana services were all deployed in containers using the Docker tool.
Figure 2Application Structure with Data Flows between Services
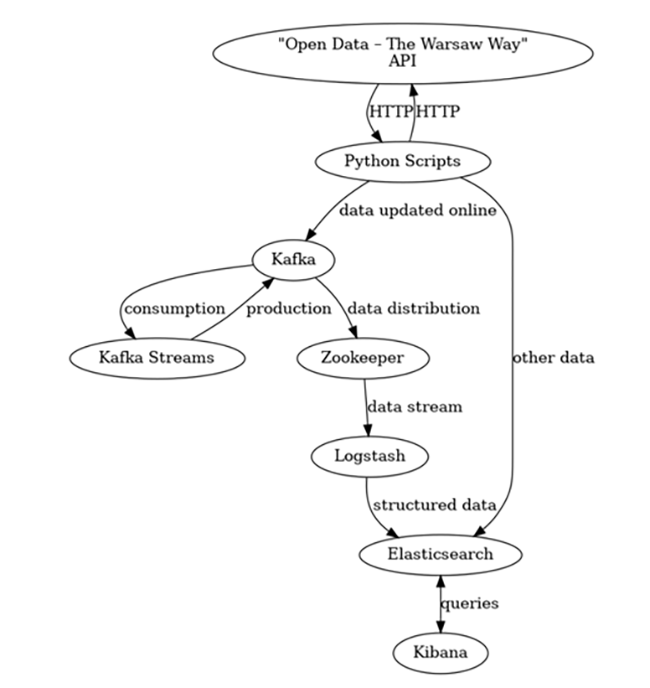
Source: authors' own work using Graphviz.
In the designed application, updated data is retrieved from the ‘Open Data - The Warsaw Way’ API using a programme in Python, which sends an HTTP GET request to the API every minute requesting information on the locations of public transport vehicles. The API responds with data in JSON format, which is transmitted to the Kafka service, specifically to a topic dedicated to raw data.
Data from the topic devoted to raw data is collected by the Kafka Streams application, which processes the data stream. At this stage, based on the change in vehicle location, the distance travelled by the public transport vehicle since the previous record and its speed are determined, with such processed messages sent to the Kafka service to a topic dedicated to processed data.
Processed data is then received from the Kafka topic by the Logstash service. Logstash transforms the data into formats recognised by Elasticsearch and subsequently sends it to the Elasticsearch service, specifically to an index dedicated to public transport vehicle data.
Data stored in Elasticsearch can be visualised using the Kibana web interface. The data presentation capabilities of Kibana are discussed in the next section.
Visualisation of Key Application Functionalities
The application’s functionalities aimed at enhancing the attractiveness of public transport usage can be divided into two groups:
- functionalities intended for public transport passengers,
- functionalities supporting public transport planning.
Functionalities Intended for Public Transport Passengers
The functionalities intended for passengers have been designed to facilitate the use of public transport and support travel planning.
The primary passenger-facing functionality is the display of the current location of buses and trams—analogous to the functionality in Uber/Bolt applications, which allow users to track their ordered vehicle in real time. Thus, there is no longer a need to be physically present at the stop to obtain arrival time information from the dynamic passenger information system, not to mention that many stops still lack such systems.
Figure 3 presents a sample view of the application, with buses and trams distinguished using icons of different colours. Trams have one- or two-digit route numbers; thus, vehicles with a route number lower than 100 are marked with yellow icons. Red icons are used for the remaining lines, representing buses in this context. The icons representing vehicles are rotated to indicate their direction of travel, providing clear information on the vehicle’s destination. Kibana enables value-based data visualisation, offering broad possibilities for presentation. Parameters can be visualised using colour, size or icon rotation.
Figure 3Sample Application View: Displaying Public Transport Vehicles in Real Time
Source: authors' own work.
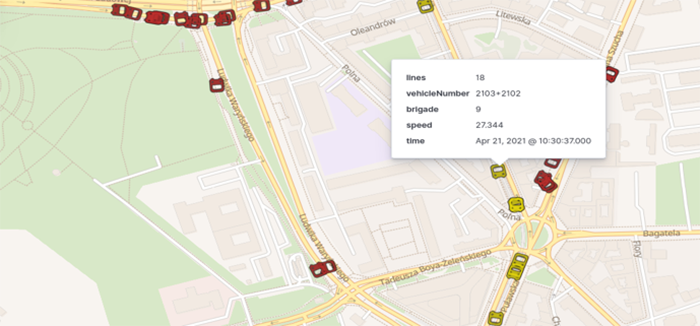
Figure 4Displaying the Location and Speed of Public Transport Vehicles in Real Time
Source: authors' own work.
Figure 4 shows vehicle locations with their speeds indicated by colour. On the adopted scale, light yellow denotes vehicles that are stationary or moving very slowly, while dark red marks vehicles moving very quickly (at speeds exceeding 50 km/h). The figure shows that on the bridge, which has no public transport stops, vehicles move much faster than in other parts of the city. This enables the estimation of arrival times at stops. Tracking the current position and speed of a vehicle thus allows passengers to optimise their arrival time at public transport stops and make better transfers, thanks to the consideration of any delays or early departures, which can be highly useful for passengers.
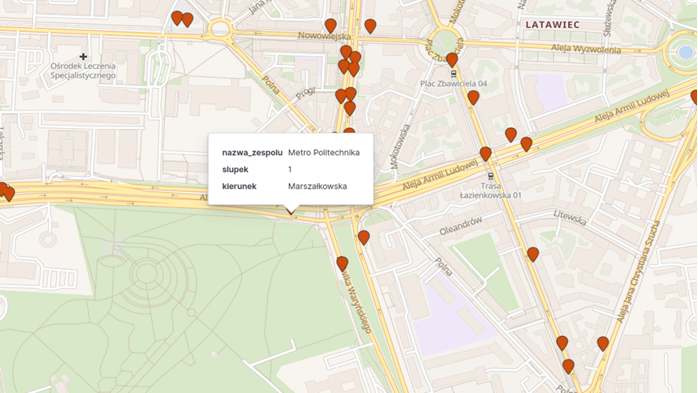
Another functionality (see Figure 5) is the display of stop locations on the map, with the possibility of viewing basic information about them, which enables users to determine the location of the stop from which a vehicle departs.
Figure 5Displaying the Location and Information about Stops on the Map – an Example
Source: authors' own work.
Functionalities Supporting Public Transport Planning
Public transport planning is an interdisciplinary field that encompasses the development of routes and transport networks, timetables, demand analysis, integration with urban space, and assessment of economic, environmental and social impact (Ceder, 2015). The second group of functionalities is designed to support public transport planning to ensure accessibility for all metropolitan residents and competitiveness with other modes of transport. The developed application includes functionalities for planning the distribution of public transport stops and planning new bus lanes.
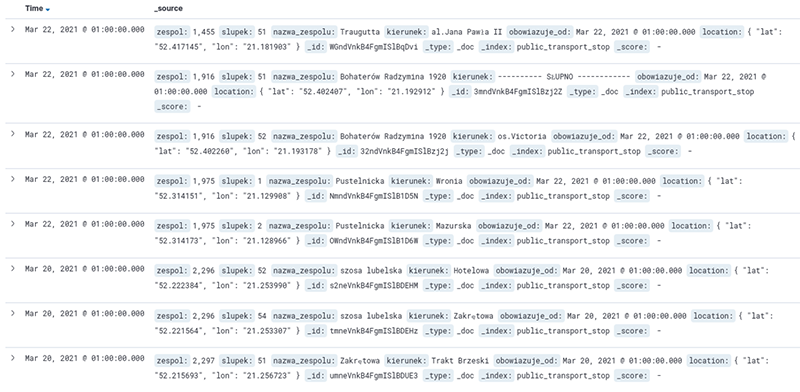
The Kibana service enables browsing the collected data. Figure 6 presents the functionality for browsing raw data, allowing users to become acquainted with the original, unprocessed data.
Figure 6Kibana – Displaying Raw Data
Source: authors' own work.
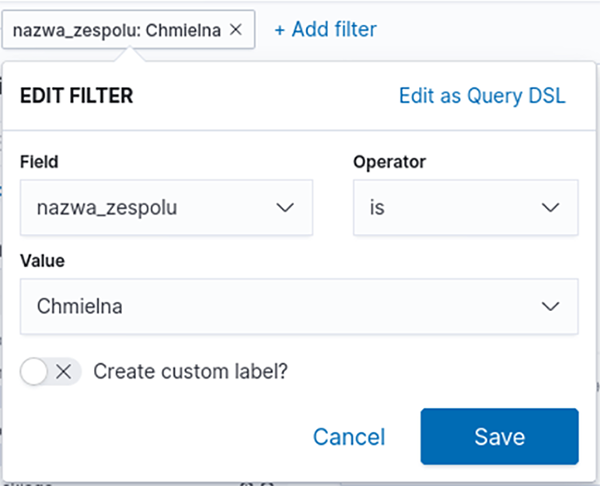
Figure 7Kibana – Data Filtering Interface
Source: authors' own work.
In addition to browsing raw data, Kibana enables ad hoc querying via a user-friendly interface. Ad hoc queries are an important element of business analysis, as they allow users to extract information that is not available in predefined reports. Figure 7 presents the data filter creation function within the developed application, where filters can be created by selecting the appropriate fields from a list, making them accessible to users without IT expertise.
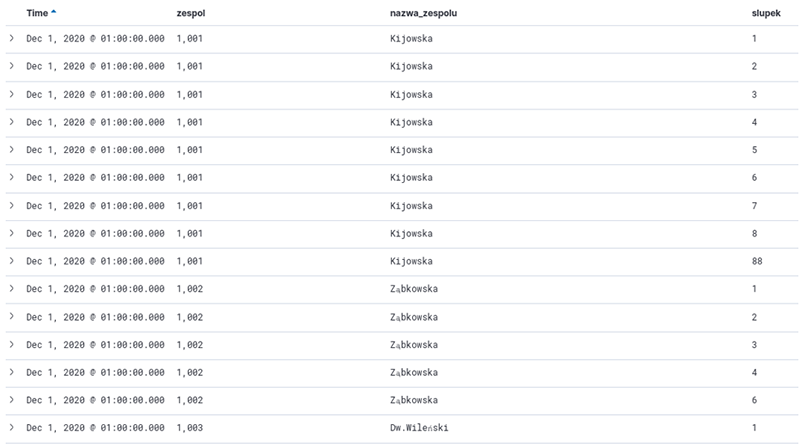
For users who require more advanced queries, there is also an option to construct queries in a Domain Specific Language (DSL) based on the JSON format. DSL significantly extends reporting capabilities, allowing, among others, for the creation of nested queries, query combination, and spatial data queries using geometric figures such as rectangles and polygons. Figure 8 presents a sample report generated with Kibana—a list of bus and tram stops served by Warsaw Public Transport.
Figure 8Kibana – Sample Report
Source: authors' own work.
Kibana also enables data aggregation, which is leveraged in the functionalities presented below. Figure 9 presents a heatmap showing the distribution of stops.
Figure 9Heatmap Illustrating the Distribution of Public Transport Stops
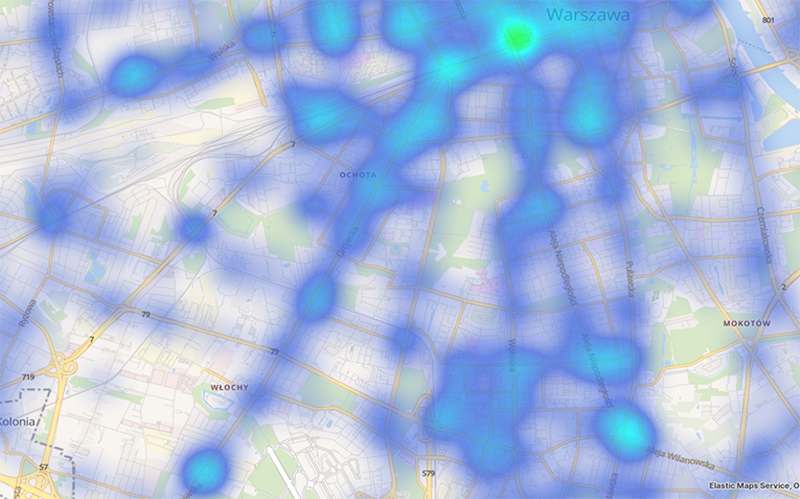
Source: authors' own work.
Turquoise areas indicate large clusters of stops, while navy blue represents small clusters and individual stops, and areas with no colour indicate regions without any public transport stops. Figure 9 shows that most residents of the south-western part of the city have good access to public transport, with a large cluster of stops visible in the city centre, while medium-sized clusters occur along streets with higher traffic volumes. Areas without public transport stops are mainly large green spaces that do not contain transport routes, although there is a visible area in the Włochy district where, despite the presence of many transport routes, there are no public transport stops. Based on such observations, the Public Transport Authority may consider establishing a new stop in this area. Unfortunately, the data provided by the City of Warsaw lacks information about stop accessibility for persons with disabilities, which would have significantly enhanced the value of the analysis.
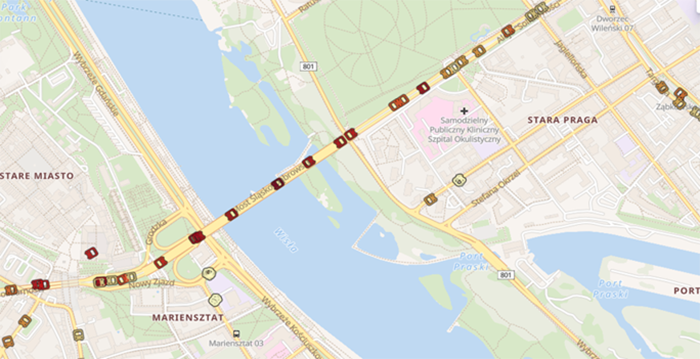
Another functionality is the analysis of aggregated vehicle speeds on a map. Figure 10 presents the average speeds achieved by vehicles, calculated based on data from a single day.
Figure 10Map Presenting Average Vehicle Speeds on Transport Routes
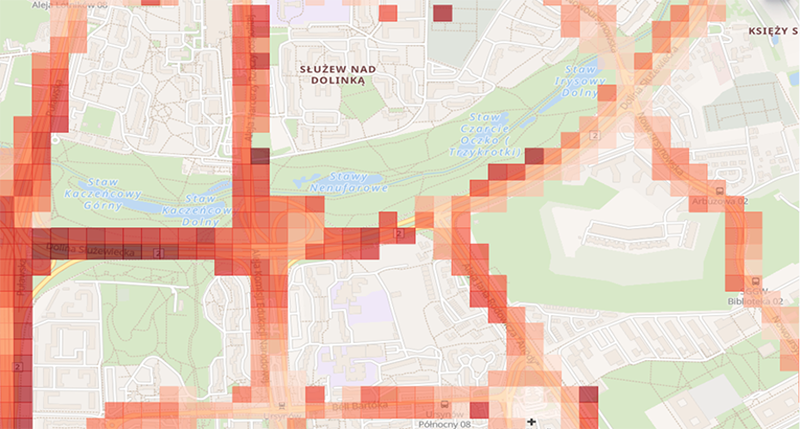
Source: authors' own work.
Dark red squares denote areas where vehicles were moving very quickly, while light orange squares indicate areas where there was significant traffic slowdown, with traffic congestion clearly visible in the figure. Based on these observations, the Municipal Roads Authority may consider designating a lane on this section for public transport vehicles only, which would enable public transport vehicles to travel significantly faster on this section than other vehicles, increasing the competitiveness of public transport compared to private cars.
Summary
Although the popularity of public transport in the Polish capital is currently increasing (ZTM, 2025), it has still not returned to the record levels of 2019 (Transport Publiczny, 2020), which, combined with the rising motorisation rate, means that public transport attractiveness in Warsaw remains a current issue, and that the consequences of the existing situation are becoming increasingly tangible for metropolitan residents. This fact inspired the presentation in this article of the authors’ proposed application, which seeks to enhance the attractiveness of such transport in the metropolis. The purpose of the proposed application was to showcase the potential of open-source Big Data tools and the data held by the City of Warsaw to continuously improve the attractiveness of public transport relative to private journeys. Its presentation required an overview of the possible architectures, from which the microservice-based architecture was selected—based on an assessment of suitability for the project’s needs and the feasibility of meeting technological requirements. The presentation of the application's various capabilities demonstrated that open-source Big Data tools can successfully support activities and decisions aimed at making public transport easier for passengers to use and provide support for public transport planning through the analysis and visualisation of vehicle movements and infrastructure planning, thus helping to mitigate the negative impact of private transport by increasing the attractiveness and popularity of collective transport. They are also useful for achieving social goals, including a reduction in transport exclusion. The proposed application is a case study for Warsaw, but similar application can be designed and implemented for any other city, not only in Poland but also globally, provided that appropriate data is made available. Limitations to the deployment of this type of application include not only data availability, but also data collection methods, the existence of metadata, time continuity, possession of data on transfers, and, ideally, data on user groups.
References
- Alamri, S., Adhinugraha, K., Allheeib, N., & Taniar, D. (2023). GIS analysis of adequate accessibility to public transportation in metropolitan areas. ISPRS International Journal of Geo-Information, 12(5), 180. https://doi.org/10.3390/ijgi12050180
- Andrei, L., & Luca, O. (2021) Open tools for analysis of elements related to public transport performance. Case study: Tram network in Bucharest. Applied Sciences, 11(21), 10346. https://doi.org/10.3390/app112110346
- Anil, N. (2023). Logging with Elastic Stack. In R. Vettor, & S. “ardalis” Smith (Eds.), Architecting Cloud- Native .NET Apps for Azure (pp. 131-134). https://docs.microsoft.com/pl-pl/dotnet/architecture/cloud-native/logging-with-elastic-stack
- Bartoszuk, M., Cena, A., & Gągolewski, M. (2016). Przetwarzanie i analiza danych w języku Python [Data processing and analysis in Python]. Wydawnictwo Naukowe PWN.
- Behera, R. K., & Kalipe, G. K. (2019). Big Data Architectures: a detailed and application oriented review. International Journal of Innovative Technology and Exploring Engineering, 8(9), 2182–2190. https://doi.org/10.35940/ijitee.H7179.078919
- Ciekawestatystyki.pl. (2025). Wskaźnik motoryzacji. Ile samochodów osobowych jest w Polsce [Motorization Index: How many passenger cars are there in Poland?]. https://www.ciekawestatystyki.pl/2023/09/ile-pojazdow-jest-w-polsce.html
- Ceder, A. (2015). Public transit planning and operation: Modeling, practice and behavior (2nd ed.). CRC Press. https://doi.org/10.1201/b18689
- Dzikowski, J. (2014). Apache Kafka. http://dzikowski.github.io/2014/12/07/kafka/
- Elastic. (n.d.). The Elastic Stack. Retrieved July 23, 2025, from https://www.elastic.co/docs/get-started/the-stack
- Gadziński, J., & Goras, E. (Eds.). (2019). Transport i mobilność miejska. Raport o stanie polskich miast [Transport and urban mobility. Report on the state of Polish cities]. Instytut Rozwoju Miast i Regionów w Warszawie.
- Goliszek, S. (2021). GIS tools and programming languages for creating models of public and private transport potential accessibility in Szczecin, Poland. Journal of Geographical Systems, 23, 115–137. https://doi.org/10.1007/s10109-020-00337-z
- GUS. (2025, January 30). [Statistics Poland]. Sytuacja społeczno-gospodarcza kraju. Transport. Dane za 2024 r. [The country's socio-economic situation. Transport. Data for 2024]. https://ssgk.stat.gov.pl/01.2025/Transport.html
- Jakubowski, B., & Dulak, M. (2018). Publiczny transport zbiorowy w Polsce. Studium upadku [Public transport in Poland: A study of decline]. https://www.transport-publiczny.pl/wiadomosci/publiczny-transport-zbiorowy-w-polsce-studium-upadku-58517.html
- Kafka. (n.d.). The easiest way to write mission-critical real-time applications and microservices. Retrieved January 4, 2025, from https://kafka.apache.org/documentation/streams/
- Kim, T., Ramos, C., & Mohammed, S. (2017). Smart City and IoT. Future Generation Computer Systems, 76, 159-162. https://doi.org/10.1016/j.future.2017.03.034
- Konieczny, B. (2017). Zeta architecture. https://www.waitingforcode.com/general-big-data/zeta-architecture/read#zeta_examples_of_implementation
- Kopeć, K. (2016). Kształtowanie systemu transportowego miasta w celu osiągania wysokiej jakości życia mieszkańców [The shaping of the municipal transport system in order to achieve a high quality of life]. Autobusy: technika, eksploatacja, systemy transportowe, 17(12), 665–669.
- Krajewska, R., & Łukasik, Z. (2017). Efektywne wykorzystanie infrastruktury transportowej w miastach: przykłady dobrych praktyk [Efficient use of transport infrastructure in cities: examples of good practice]. Autobusy: technika, eksploatacja, systemy transportowe, 18(9), 203–211.
- Lewandowski, M. (2021). Wprowadzenie do Elasticsearch [Introduction to Elasticsearch]. https://czterytygodnie.pl/wprowadzenie-do-elasticsearch/
- Lopes, F., Gil, J., & Stavroulaki, I. (2023). Simplified geodata models for integrated urban and public transport planning. Proceedings of the 26th AGILE Conference on Geographic Information Science, 4(32). http://dx.doi.org/10.5194/agile-giss-4-32-2023
- Luckner, M., Kobojek, P., & Zawistowski P. (2017). Public transport stops state detection and propagation - Warsaw use case. In Proceedings of the 6th International Conference on Smart Cities and Green ICT Systems SMARTGREENS (pp. 235-241). https://doi.org/10.5220/0006305102350241
- Martin, D. (2025, November 7). Microservices architecture style. https://docs.microsoft.com/pl-pl/azure/architecture/guide/architecture-styles/microservices
- Miasto Stołeczne Warszawa. (2015). [City of Warsaw]. Otwarte dane - czyli dane po warszawsku [Open Data - The Warsaw Way]. http://api.um.warszawa.pl
- Mindbox. (2021). Docker – czym jest konteneryzacja i dlaczego może się ona przydać w Twojej firmie? [Docker – what is containerization and why can it be useful in your company?]. https://mindboxgroup.com/pl/docker-czym-jest-konteneryzacja-i-dlaczego-moze-sie-ona-przydac-w-twojej-firmie/
- Mucci, T., & Stryker, C. (2024). What is big data analytics? https://www.ibm.com/topics/big-data-analytics
- Nag, A., Alahi, M. E. E., Afsarimanesh, N., Prabhu, S., & Mukhopadhyay, S. C. (2019). IoT for smart homes. In O. A. Postolache, E. Sazonov, & S. Ch. Mukhopadhyay (Eds.), Sensors in the age of the Internet of Things - technologies and applications (pp. 171-199). Institution of Engineering and Technologyhttps://doi.org/10.1049/PBCE122E_ch7
- Naro, G., Biraghi, C. A., & Lenzi, E. (2024). City Transport Analyzer: A powerful Qgis plugin for public transport accessibility and intermodality analysis. International Archives of the Photogrammetry Remote Sensing and Spatial Information Sciences, XLVIII-4/W12-2024, 113–119. https://doi.org/10.5194/isprs-archives-XLVIII-4-W12-2024-113-2024
- Niedzielski, M. A., Goliszek, S., & Górka, A. (2024). Signals, tracks, and trams: public transport signal priority impact on job accessibility over time. Scientific Reports, 14, 23459. https://doi.org/10.1038/s41598-024-74960-x
- Nowak, J. (2020). Konteneryzacja: pudełko pełne oszczędności [Containerization: a box full of savings]. https://ccaeurope.pl/pl/konteneryzacja-pudelko-pelne-oszczednosci/
- Pałys, Ł., Ganzha, M., & Paprzycki, M. (2022). Applying machine learning to predict behavior of bus transport in Warsaw, Poland. arXiv:2204.04515 [cs.LG]. https://doi.org/10.48550/arXiv.2204.04515
- Prommaharaj, P., Phithakkitnukoon, S., Demissie, M. G., Kattan, L., & Ratti, C. (2020). Visualizing public transit system operation with GTFS data: A case study of Calgary, Canada. Heliyon, 6(4), e03729. https://doi.org/10.1016/j.heliyon.2020.e03729
- Scott, J. (2015). Zeta Architecture: Hexagon is the new circle. https://www.oreilly.com/content/zeta-architecture-hexagon-is-the-new-circle/
- Tejada, Z. (2025). Architektury dużych zbiorów danych [Big data architectures]. https://docs.microsoft.com/pl-pl/azure/architecture/data-guide/big-data
- Transport Publiczny. (2020). Warszawa: 1,2 mld pasażerów komunikacji miejskiej w 2019 roku [Warsaw: 1.2 billion public transport passengers in 2019]. https://www.transport-publiczny.pl/wiadomosci/warszawa-12-mld-pasazerow-komunikacji-miejskiej-w-2019-roku-63888.html
- Uchwała nr 8 Rady Ministrów. (2017). Uchwała nr 8 Rady Ministrów z dnia 14 lutego 2017 r. w sprawie przyjęcia Strategii na rzecz Odpowiedzialnego Rozwoju do roku 2020 (z perspektywą do 2030 r.) [Resolution No. 8 of the Council of Ministers of 14 February 2017 on the adoption of the Strategy for Responsible Development until 2020 (with a perspective until 2030)]. https://sip.lex.pl/akty-prawne/mp-monitor-polski/przyjecie-strategii-na-rzecz-odpowiedzialnego-rozwoju-do-roku-2020-z-18579532
- Vinka, E. (2018). What is Zookeeper and why is it needed for Apache Kafka? https://www.cloudkarafka.com/blog/cloudkarafka-what-is-zookeeper.html
- Walków, M. (2020). Pandemia uderzyła w polską kolej. Niektórzy widzą jednak szansę w kryzysie COVID-19 [The pandemic has hit Polish rail hard. However, some see the COVID-19 crisis as an opportunity]. https://businessinsider.com.pl/finanse/makroekonomia/transport-kolejowy-w-polsce-wplyw-pandemii-covid-19-na-przewozy-pasazerskie-i-cargo/mxl549c
- ZTM. (2025). Niemal miliard pasażerów Warszawskiego Transportu Publicznego [Almost a billion passengers of Warsaw public transport]. https://www.ztm.waw.pl/informacje-prasowe/2025/02/12/niemal-miliard-pasazerow-warszawskiego-transportu-publicznego/
 https://orcid.org/0009-0006-6080-183X